The U.S. Economy: Stand by for more worse news

Posting following quote in this thread now (4July) is sort of a less than week a head prediction that for this Treasury "party" the guest will want to be paid well* to come:

" The Treasury Department will auction $32 billion of three-year notes on Tuesday**, $21 billion of 10-year notes on Wednesday and $13 billion of 30-year notes on Thursday. "

* "Well" being defined as a 10 year bond rate of at least 2.6%
** 9 July 13.

Lenders are starting to realize that when the bonds they buy mature, the purchasing power of the "face value" they collect is much less than that they bought the bonds with. Thus, to reduce their real losses they need (and will demand) higher interest rates. I may be a few weeks early in my expectations that will happen at next week's Treasury auction, but following makes me think not:

"Americans owe more money, collectively, than ever before in our history – far, far, far more. We owe at every level: $17 trillion at the federal level, $13 trillion in mortgages, another trillion in student loans, and nearly $3 trillion in state and local government debt. Put all of these numbers together and you end up with a $60* trillion pile of obligations. That's nearly four years' worth of our entire country's total production."

BTW, the interest rate on student loans, has recently doubled, I think. Please correct if not true.

* 17+13+1+3 = 44 not 60, but article included other debts.
 
Last edited by a moderator:
Why dollar will crash:
chart1_brian_0708.jpg
hard to read so: Red section is federal deficit in Trillions. Spending has grown 75.7% while revenues has grown only 38.5% in nine years (2003 to 2012) but that has gotten dramatically worse in last 5 years (2007 to 2012) in the long lasting recession and gap is widening.
 
https://order.investorplace.com/?sid=ED8577&cs=ED8555&en=1400306 said:
I say a major market tumble is imminent — I’m not talking about June’s 2-day rollercoaster. ... Why? Because you need certain catalysts to ignite and sustain a rally…
but we don't have:

(1) A strong economy — we’re in the slowest economic recovery in U.S. history, with 3 million FEWER jobs than in 2007.
(2) Red-Hot market sectors — the top sectors are lukewarm and the growth rate was actually revised down from a tepid 2.5% to 1.8%.
(3) A groundbreaking technology* — yet nothing exciting has emerged in months. ... If you follow the market closely, you know the last earnings season was lukewarm at best. There’s nothing to inspire the up-rally we’ve seen. Clearly, something’s very wrong. ... Make no mistake: by inflating the money supply, the Fed is quietly waging war against investors with a “fake rally.”

Our recent market boom is being fueled by excess cash pumped into the markets by the Fed. They’ve injected so much liquidity that stocks have no place to go but up… until this house of cards they’ve built collapses under its own weight. ... What will knock the legs out from underneath this rally — is this:

The extra money the Fed’s created out of thin air has worked its way through Wall Street. After the initial run-up in prices, more money tends to have less effect. ... The Fed’s printing press is becoming less effective by the day… Let me be crystal clear: the rally we’ve seen starts and ends with the Fed’s inflation of the money supply. It sparked the rally, and it will bury it. ... The game becomes obvious by understanding two simple charts:
Chart1.jpg

Notice the blue arrow, showing money growth starting to pick up in 1994 — which is a natural result of the strong economic growth we experienced.
But as you can see by the RED arrow, since 2008, it’s accelerated skyward at a dangerous rate… without accompanying economic growth.

Here’s my point: Other than money created from thin air, courtesy of the Fed’s printing press, there’s little else powering the markets today.
Chart2.jpg
It’s obvious that Bernanke’s “Free Money Truck” still drives the market — even if it’s off the road. Just hinting at putting on the brakes (or easing his foot off the gas) sends investors scrambling. ... The S&P chart below clearly illustrates the illusion behind the bull-run in stocks over the last four years. The black line on the chart is the S&P 500. The blue line is the “fair market value” of the S&P 500 — what the value should be, based on corporate earnings calculations. As you can see the blue line moves in a smooth, upward, diagonal direction as earnings steadily increase. In contrast, the S&P 500 fluctuates all over the place — above and below our fair value line. If you study the chart carefully, the drivers of stock market performance become clear. Every time the market jumps, it’s because the Fed’s Free Money Truck made another delivery.

During the height of the 2008 crisis, the S&P 500 plunged far below fair value as investors fled in fear of the next great depression. As the economy stabilized a bit, the Fed flooded the system using the “free money truck” and stocks quickly rebounded, as shown by the label “Fed expands QE1” in mid-2008. But since mid-2009, when stocks shot above the fair-value, the policy’s changed to one of financial recklessness. From mid-2009 until mid-2010 stocks rode the Fed’s “free money truck” (QE1) to a level far detached from underlying fundamentals. The market nose-dived back to fair value…. So, Bernanke went back on the road for a second joy ride (QE2)! This only dumped fuel on the fire… Each time the market has tried to right itself, Bernanke and company have instituted false foundations to prop it back up — QE3, Twist 2, bond buying… and the infinite QE4! To the tune of $85 billion per month in mortgage-backed securities and long-term Treasuries, while keeping the interest rate near zero.

It’s abundantly clear… today’s real earnings are not supporting the recent rally. Technology breakthroughs are not. The economy certainly is not. Without proper fundamentals in place, the market is floating on a fantasy. A Fed-built, skyscraper-sized house of cards. And when that unstable, unsustainable structure tumbles, we could be looking at a 2008 déjà vu moment.
* On "not have (3)" above: We do have shale oil - that helped boost the economy up for the 2008 crash, as it lowers import cost, but rising interest on the rising debt will still prevail.

For about a year in several posts I (Billy T) have quickly stated Richard Young's POV by: "The Fed has a tiger by the tail, and can't let go without great loses."
Ben will let the next chairman (or woman) take the blame for market and dollar collapse "On or before Halloween 2014," as I predicted ~6 years ago!

Corporations and the rich are doing well selling to Asia etc. but here is the no strong US economy. Here is more evidence of how badly the real economy is doing:
Chart3.jpg
Chart4.jpg
Chart5.jpg
From same source: "We’ve lost 1/4 of the jobs since the Bush/Obama spending spree began.
Worse, as the blue arrow above illustrates, we haven’t had production levels this low since 1961. ... What all 3 charts actually show, are several sharp downturns, punctuated by short rallies, as the economy eventually finds its real bottom. We’re about to die the death of a thousand cuts.

So the true story of 2013 — and beyond — is the continual decline of the American economy and its financial markets. "
 
Last edited by a moderator:
Unwinding the Fed's balance sheet - How?
http://seekingalpha.com/article/1622792-a-close-look-at-feds-balance-sheet-unveils-a-cliff?source=email_macro_view&ifp=0 said:
nobody has a clue how the Fed will exit the QE. Even Mr. Bernanke, who earned the Fed a reputation of being transparent, didn't talk about it much. If the Fed sits on its hands, the QE will drain itself when the securities mature.* And it will start as soon as 2016.

If the securities are left to retire themselves, the term structure of Fed's balance sheet dictates the path of the passive exit. ... The Fed loaded up in the QE. Graph below shows when its Treasury holdings mature:
901853-13759941980354793-Diffusion_origin.png
The grayed-out bars represent those have already matured. The red bars are the short-term Treasuries the Fed sold in Operation Twist. It doesn't mean the Fed was "short" the securities. Before the QE the Fed had about $700B to $800B worth of Treasuries on its balance sheet. The Fed sold some short-term ones in its reserve and replaced them by long-term ones, in order to twist the yield curve. ... The scary part is that the term structure is heavily front-loaded. Excluding the grayed-out bars and the red bars, the first blue bar in 2016 is already 11% of the entire holdings. By the end of 2017, 20% of holdings will be drained. More than 50% will be drained between 2016 and 2019, a 4-year span.

In 2016, $173B of Treasuries will mature. 2017 is almost the same. 2018 and 2019 are even worse, more than $250B. To put the numbers into perspective, the 2012 U.S. GDP is $15.7T. $250B is 1.6% of GDP. And how fast our GDP grows? Less than 2%.

The internal mechanism can be complicated, but the cash has to come from somewhere. Subtracting more than 1% GDP worth of cash from the financial system surely sounds like a cliff. And it's for four consecutive years.

* That is the only realistic way - Fed is now the buyer of >80% of new treasury paper. Who could it sell to? Answer: No one, except in a "fire sale" at prices greatly lower than the Face Value of the bonds and mortgages it holds. I.e. Fed would need to admit its assets are not worth what it claims and take a loss. When Fed takes a loss so does the dollar - the pain is transferred to the tax payers and the holder of dollar based assets.

Note: With the "let holdings mature, to void selling at deep discount" method for clearing of Fed's "stimulus buying" to help the recovery means 52% of the QEs will be dumped back on the economy in only four years! Don't you think about 1.5 trillion of "negative stimulus" will sink the ship of state (if bond vigilantes and or China have not already sent it to the bottom of the ocean?) Thus I continue to think the Fed has a tiger by the tail and dare not let go. I.e. the production of thin-air money will continue until the dollar collapses. (To be replaced by the Gold backed RMB.)

One likely possibility IMHO is the Fed will join the rest of the government in "kicking the can down the road." I.e. to help the Treasury pay off the bonds maturing in 2016, the Fed will run the thin-air dollar printing presses even faster to make new dollars it can use buying new treasury bonds, maturing in 2024, when few are now scheduled to mature (See graph above.) Although not actually mechanical, these presses can break if run ever faster. I.e. the Fed may be able to delay the disaster by making it even worse when Fed can not run the thin-air dollar presses even faster. In other words: The printing of ever more thin-air money is the road to an ever worse economic hell.
 
Last edited by a moderator:
New%20Part%20Time%20Normal%20Cartoon_0.jpg
Forgive me Michael. I'm adding add some numbers to your post:

In 2013's first half 77% of ALL new jobs created were part-time jobs and most were low hourly pay with no health care, etc. benefits also. An unknown, but probably large reason is that the employer does not need to contribute to cost of their "Obama care" as with a full time employee. I.e. this is very likely NOT a "one time" glitch but the new norm. I made same point of your graphic here: http://www.sciforums.com/showthread...ent-in-March&p=3096764&viewfull=1#post3096764 and in next post, 51, gave data on the fact that those who have a good full time job are not retiring from it at age 60 or 65, but holding on to it even into their 70s, much more than they did only a decade ago. I.e. times are tough and getting tougher for the young trying to move out of the Dad's basement, get married, etc.
 
Last edited by a moderator:
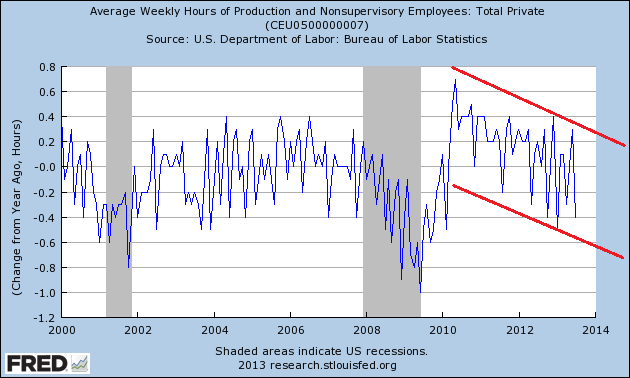
saupload_z-temp20.png
Downward trend is mainly due, I think, to the upward trend in part-time jobs being created. (77% of new jobs in first half of 2013 were part-time jobs, and most at low pay with no health care, etc. benefits.) - Not the way to build a healthy economy.

In China, out of pocket cost of health care has been reduced by 50% and purchasing power of salaries is growing annually by double digits - The CCP is doing all it can to switch to a domestically driven economy, instead of an export led one as US & EU are broke and can only buy, if China lends then the funds.

Despite my comments added to post 605, Obama care, probably is not the main reason, as now the start of the requirement for employers to contribute has been delayed a year (now 1 January 2015) The very sick economy is probably why employers are letting go full time employees and hiring lower cost part-timers. The new hires can't buy as much so even sales at cheap outs are dropping now - this is a self accelerating process - Manufactures selling in the US (Not Asia) don't produce as much as they did so need fewer full time employee, and then there is even less purchasing power in the market place.
 
IMHO...Until we hit -0.6 that could be in 2016 - we are not there yet. Then the location to -1.0 that could be in 2017-18. This time not coming back unless China, Japan and Korea support us....
 
IMHO...Until we hit -0.6 that could be in 2016 - we are not there yet. ...
Yes, but interesting to me is the fact that the red lower boundary line hits -0.6 on Halloween 2014.

Why did you focus on -0.6? When one enters the next recession, I think, crashing thru -1% is very likely. Main reason "were not there yet" is the 85Billion per month of thin-air money being "printed." That is not sustainable - will end by choice or necessity before Halloween 2014.

Start painting your "Brother can you spare a dime?" sign soon.
 
My feeling many of this prediction are not wort the paper. I am playing the stock market for over 35 years . I see changes like playing yo yo , and thank God I am in a better position now then in the so called good years.
 
My feeling many of this prediction are not wort the paper. I am playing the stock market for over 35 years . I see changes like playing yo yo , and thank God I am in a better position now then in the so called good years.
Good for you. Every one can hold their own view about the future. I have been trading stocks, mainly buy an hold, for more than 50 years with considerable success too. (I never owned a business - only had a salary for 30 years before retiring 20 years ago, yet because I often correctly foresaw, before others, what was coming, I am more than doubly a millionaire with 53 stocks now in my portfolio now. - Too many and for that and other reasons I'm a net seller now using losses to offset profits.) We will just need to wait to see what the future brings.
 
http://www.bloomberg.com/news/2013-08-26/obama-officials-said-divided-on-fiscal-debate-strategy.html said:
House Speaker John Boehner told his colleagues on a conference call last week that the across-the-board government spending cuts will stay in place until Obama proposes a replacement package. ... White House press secretary Jay Carney repeated that the administration “will not negotiate” on the debt ceiling.

Complicating the differences over federal spending, a group of Republicans led by Senators Ted Cruz of Texas, Marco Rubio of Florida and Mike Lee of Utah say they’re willing to force a government shutdown unless funding is cut off for the president’s signature health care law. ... The U.S. 10-year yield fell three basis points, or 0.03 percentage point, to 2.79 percent at 4:20 p.m. in New York, according to Bloomberg Bond Trader prices.*

In recent appearances, the president has put the blame on “a strong faction” of Republicans who are focused on trying to block his plans rather than do what’s best for the economy. “They’re threatening to shut down the government and have another financial crisis unless, for example, we get rid of the health care reform that we fought to pass,” he said Aug. 23 in a speech on higher education costs at Lackawanna College in Pennsylvania.

Obama is seeking to replace automatic spending cuts with other reductions and additional revenue. He will oppose efforts by House Republicans to spare defense from further cutbacks at the expense of domestic programs, such as education, Burwell said. “The president has been clear on that point,” she said.
This does not sound so good and BTW, Congress is on vacation until 9 September.

Two definitions of insanity seem to apply to Congress:
(1) Einstein's "Doing the same thing again and expecting different results."`
(2) The psychiatric one: "A persistent refusal to deal with reality."

* I.e. the bond market is not worried, yet. Thinks they will work something out - probably using their experience-honed skills at kicking the can down the road, again.
 
There is ALWAYS good news for lawyers. The corollary is their is (on average) bad new for those dealing with them.
http://www.bloomberg.com/news/2013-08-28/u-s-bank-legal-bills-exceed-100-billion.html said:
The six biggest U.S. banks, led by JPMorgan Chase & Co. (JPM) and Bank of America Corp., have piled up $103 billion in legal costs since the financial crisis, more than all dividends paid to shareholders in the past five years. Bank of America, led by Chief Executive Officer Brian T. Moynihan increased its legal costs by $3.3 billion in the first half to a total of $19.1 billion. It’s the amount allotted to lawyers and litigation, as well as for settling claims about shoddy mortgages and foreclosures, according to data compiled by Bloomberg. The sum, equivalent to spending $51 million a day, is enough to erase everything the banks earned for 2012.

The mounting bills have vexed bankers who are counting on expense cuts to make up for slow revenue growth and make room for higher payouts. About 40 percent of the legal and litigation outlays arose since January 2012, and banks are warning the tally may surge as regulators, prosecutors and investors press new claims. The prospect is clouding outlooks for stock prices, and by some estimates the damage could last another decade.
This is an accidental partial repeat of post here: http://www.sciforums.com/showthread...e-bad-news-is&p=3103064&viewfull=1#post310306
I had left note here telling text of quote would soon appear, but had to leave and when came back, next day I posted it at link above with comments telling why the above it just the tip of the bank sinking iceberg. (Most do not need to pay their sliced and diced mortgage - the courts have said!)
 
Last edited by a moderator:
Figure's original Caption is: Calved icebergs from the nearby Twin Glaciers are seen floating on the water in Qaqortoq, Greenland
inGclrMyEZ4A.jpg
More and accelerating evidence world is headed for 60 Trillion loss damage via melting ice as recent article in Nature* predicts:
http://www.bloomberg.com/news/2013-09-05/ice-melting-faster-in-greenland-and-antarctica-in-un-leak.html said:
A draft of the study was obtained by Bloomberg from a person with official access to the documents who declined to be further identified because it hasn’t been published. ... A summary of the latest 2,200-page report designed to guide lawmakers worldwide as they work to devise climate policies is due for publication on Sept. 27 in Stockholm after a four-day meeting where the wording will be finalized.

Greenland and Antarctica contain enough ice to raise global sea levels by almost 66 meters (217 feet), a process that would take thousands of years. {That 1000 years is because now Antarctica's ice is only melting at the ocean margins, not the land supported ice, which may be slightly growing with snow fall increasing. (warmer oceans = more evaporation). Strange as it may seem, that falling snow is adding heat from the warming oceans to the Antarctic as warmer** that the ice sheets, especially if it is dirty snow increasing solar absorption. The Arctic ocean will be ice free in less than a decade in early fall and every year thereafter for increasingly longer periods. Modeling the melting of Greenland's miles thick ice is very complex with widely varying estimate of how long it will last. Less than 4% of that ultimate rise floods many costal cities, at least during storms. That causes 60 trillion more cost on generations who are already being born with huge debts to pay. No wonder babies cry at birth! (A Billy T insert.)}

Greenland’s contribution to rising sea levels “very likely” rose to an average of 0.59 millimeters a year from 2002 to 2011, from 0.09 millimeters a year in the prior decade, according to the draft. The rate in Antarctica “likely” rose to 0.4 millimeters a year from 0.08 millimeters, it said. {0.59 / 0.09 = 656% per decade rate of increase} The report defines “very likely” as a probability of greater than 90 percent and “likely” as at least 66 percent.

Greenland may add a total of 4 centimeters to 21 centimeters to ocean levels by the period 2081 through 2100, across a range of carbon-emissions scenarios assessed in the study, compared with the period 1986 through 2005. That’s up from a 2007 forecast of 1 centimeter to 12 centimeters, when the UN carried out its last major assessment of climate science.{I. e. the near term two decade rate of acceleration is 4/ 1 to 21 / 12 or between 400% to 175%. I.e. the acceleration its self is accelerating.
In physic the term for the acceleration of acceleration is "Jerk" - That seems appropriately applied to mankind, which continues to burn oil to fuel his cars when a cheaper per mile driven replacement is available, with 30+ years of demonstrated use.
Acceleration is in M/sec^2 and Jerk is in M/sec^3.

* Nature reference is here: http://www.nature.com/nature/journal/v499/n7459/full/499401a.html but not fully available for free so see discussion of it here: http://www.theguardian.com/environment/2013/jul/24/arctic-thawing-permafrost-climate-change

** If you live where heavy snow falls occur, you know from personal experience that they never come when the air is very cold, only in the spring as it is warming.
 
Last edited by a moderator:
http://www.bloomberg.com/news/2013-09-13/washington-leadership-vacuum-raises-risks-of-shutdown.html said:
The House has just five work days scheduled before a Sept. 30 deadline to pass a government funding bill. No legislation is ready, since some Republicans rejected the first try offered by their leaders. .“I don’t exactly have control of the steering wheel and I’m not sure any one individual does, even Speaker Boehner,” said Representative Scott Rigell, a Virginia Republican among those opposing the leadership budget proposal.

Without such legislation, the government loses authority to spend after this month. Payments to contractors would stop, federal workers would be furloughed and programs not deemed essential would be disrupted. Then, unless Congress raises the $16.7 trillion debt limit, expected to be reached as early as mid-October, the Treasury would be unable to pay creditors. The nation’s credit rating could decline and the U.S. ultimately would default.
{Billy T insert: No, no default so long as Treasury can make and give to Fed, as backing for more thin-air money a trillion, dollar silver coin.}

The market for U.S. government debt has yet to react to any potential impasse over raising the borrowing ceiling, as investors weigh prospects for Federal Reserve stimulus. The yield on the benchmark 10-year Treasury note yesterday was little changed at 2.91 percent. The Standard & Poor’s 500 Index of U.S. stocks reached a four-week high on Sept. 11, and slipped 0.3 percent yesterday to 1,683.42 in New York, snapping the longest streak of gains since July.

The four top leaders of the House and Senate held a rare joint meeting yesterday to discuss their plans to address those issues. They exited the meeting with no sign of progress. “A small but vocal minority of Republicans here in the Senate, less than half of the Republicans in the Senate, seem to live in an alternative universe to keep demanding the impossible,” Senate Majority Leader Harry Reid, a Nevada Democrat, told reporters after the meeting.

With that kind of stalemate, the way ahead is unclear. In past years, the leaders have found ways to reach an agreement, and drag their reluctant caucuses along, even if it comes down to a last-minute deal. There is room for compromise: Most Republicans say they hope to avoid a government shutdown, as do Obama and the Democrats, and few in Congress say letting the country default on its borrowing is a good idea.

It’s just not clear it’ll work out that way this time.
I'm reminded of investment service's warning: "Past performance is no guarantee for future performance."
 
I'm reminded of investment service's warning: "Past performance is no guarantee for future performance."

Well therein lies your only hope for an economic Armageddon. The only way we are going to see an economic Armageddon is if Republicans send the nation into a debt default through their fiscal and political incompetence and profligacy.
 
Well therein lies your only hope for an economic Armageddon. ...
I don't have any such hope - just the expectation that will happen, as it always does to people or nations than think they can forever live beyond their means by borrowing. A day of reckoning always comes. Now that both interest rate and the debt is increasing US's day of reckoning is coming more rapidly. - May arrive "on or before" Halloween 2014, as I predicted in a post near end of 2007 with less definite dates specified (between 2015 to 2017) in in predictions back when GWB still had more than two years as POTUS.

Likewise, I don't have any hope CH4, ~20 times worse per molecule GHG than CO2, release rate will accelerate and cause serious climate change problems - just the expectation that will happen. etc.

$ 16,862,434,571,600 US debt as of a few minutes go. See it grow at: http://www.worldometers.info/us-debt-clock/ A $16.8 trillion debt, is more than$53,000 for each US citizen, Or $212,000 per family of four Or 4 or 5 times their equity in their home.
imgres
 
Last edited by a moderator:
I don't have any such hope - just the expectation that will happen, as it always to people or nations than think the can forever live beyond their means by borrowing. A day of reckoning always comes. Now that both interest rate and the debt is increasing US's day of reckoning is coming more rapidly.

And what proof do you have that the country is living beyond its means? The US deficit has fallen by 50% and is now more in line with historical norms, which by the way was fully expected. As the US emerged from the recession government spending eased and government revenues increased as more and more people became employed.

Your premise is false. The US is not living beyond its means. The US is a very wealthy country with extraordinarily low tax rates. The US has the ability, the means, to pay its debts. The real question is do we have the political will to do so?

Back some 35 years ago President Reagan signed onto law unprecedented increases in payroll taxes which racked up huge Social Security and Medicare surpluses over the course of subsequent decades. But the government spent those surpluses on tax cuts for the wealthiest among us...the Reagan & Bush II tax cuts. Just restoring US tax rates to what they were a half century ago, it would add more than 300 billion dollars each and every year to the nation’s income.

The US has a lot of untapped taxing ability. US taxes are among the lowest in the world and certainly the industrial world.


http://www.huffingtonpost.com/robert-reich/why-we-must-raise-taxes-o_b_844606.html

http://www.moneynews.com/Kleinfeld/tax-haven-US-investor/2013/07/08/id/513734

http://www.truth-out.org/archive/item/83147:reagan-the-great-american-socialist


Trinidad and Bolivia have higher effective tax rates than the US. According to that conservative bastion, The Heritage Foundation, the US effective tax rate is 26.9 percent. Compare that to the socialistic commie Swedes who have a tax 45.8% income tax rate.

http://en.wikipedia.org/wiki/List_of_countries_by_tax_revenue_as_percentage_of_GDP

Below is a chart showing Swedish economic growth.


Sw_real_gdp_growth.svg


And those socialistic, commie, fascist Swedes have an economy that has and continues to grow in multiples of the real US growth rate.

The US has the means to pay its bills. The question is, does it have the political ability to do so? The US has the ability to double its income and still grow the economy. The question is, does it have the political ability to do so.
 
Last edited:
How is this PER CAPITA DEBT for "proof" that Americans are living beyond our means (or the graph below your post)? Lets ask Greece, France, Spain and Portugal for some help.
-1.preview.png
US per capita debt is now growing 7 times faster than that of Italy!
And what proof do you have that the country is living beyond its means? The US deficit has fallen by 50% and is now more in line with historical norms, ...
I don't think more than $53,000 debt per US citizen (man, woman and Child) is the "historic norm" and Yes the debt is INCREASING now more slowly but still becoming a greater percent of GDP. And unlike Japan where ratio is much worse, we owe large fraction to foreigners, like China (#1), Japan (#2), and Brazil is Number three (be nice to me)!
Per capita debt up 53.0 / 44.2 is a 20% increase in less than two years! Unfortunately, the S*it may hit the fan by Halloween 2014 at that rate.

Debt%20to%20GDP%20Q1%202013.jpg
... Just restoring US tax rates to what they were a half century ago, it would add more than 300 billion dollars each and every year to the nation’s income.
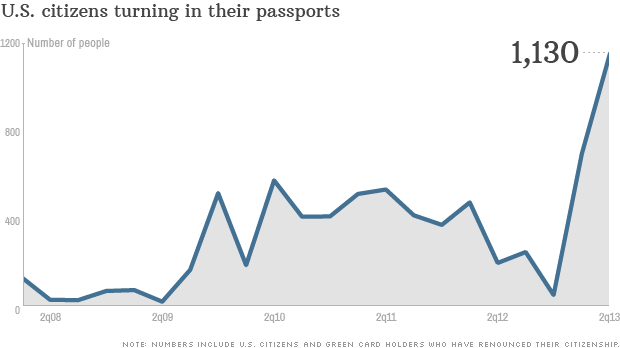
Ahhhm yes the good old tax the rich "solution" Have you noticed the surge in the rich Americans turning in their passport? It is accelerating now that IRS has Switzerland's agreement to turn in Americans with hidden funds, lines will be forming to do that as giving up US citizenship surges to a new level. Some might say: "Good - the rats are leaving the sinking ship."
130902110701-citizenship-passports-620xa.png
The Swiss banks agreed less than a month ago - This trend is just starting.
 
Last edited by a moderator:
I don't think more than $53,000 debt per US citizen (man, woman and Child) is the "historic norm" and Yes the debt is INCREASING now more slowly but still becoming a greater percent of GDP.

For starters there is a difference between debt and deficit. And deficits are now close to historic norms.

The national debt is per the US Treasury $11,973,170,292,026.36. The current estimated US population as of this writing is 316,670,650. So if you do the math, the US per capita debt is $37,809.54. That is a far cry from the $53,000 number you have claimed. What you have done is include interagency debt, which isn’t debt. It is money the government owes to itself. It is an internal transfer. It is an artifact of fund accounting which is the kind of accounting used by charities and governments. If government used corporate accounting methodology, those interagency debts would be netted out and they would not show up in the financial statements. So basically you are significantly overstating government debt by including interagency debt in the national debt.

http://www.treasurydirect.gov/NP/debt/current

http://www.census.gov/popclock/

And yes the national debt is growing. It has been growing for most of our existence. Our national income grows, our population grows and our national debt also grows.
 
How is this PER CAPITA DEBT for "proof" that Americans are living beyond our means (or the graph below your post)? Lets ask Greece, France, Spain and Portugal for some help.
US per capita debt is now growing 7 times faster than that of Italy!
I don't think more than $53,000 debt per US citizen (man, woman and Child) is the "historic norm" and Yes the debt is INCREASING now more slowly but still becoming a greater percent of GDP. And unlike Japan where ratio is much worse, we owe large fraction to foreigners, like China (#1), Japan (#2), and Brazil is Number three (be nice to me)!
Per capita debt up 53.0 / 44.2 is a 20% increase in less than two years! Unfortunately, the S*it may hit the fan by Halloween 2014 at that rate.

You really need to start sourcing credible sources for your information. Using credible sources isn’t so good for demagoguery, but is much better for argument, discussion and developing reasoned conclusions.

Ahhhm yes the good old tax the rich "solution" Have you noticed the surge in the rich Americans turning in their passport? It is accelerating now that IRS has Switzerland's agreement to turn in Americans with hidden funds, lines will be forming to do that as giving up US citizenship surges to a new level. Some might say: "Good - the rats are leaving the sinking ship."
The Swiss banks agreed less than a month ago - This trend is just starting.

Yeah, we have heard the “can’t tax” the rich excuse or they will leave excuse many times before. But they have not left. For starters, where are they going to go? If you looked at the references in my last post, there wasn’t a developed country around with lower tax rates. I suppose they are all going to jump in their private aircraft and go to Syria? I don’t think so.

Do you really think the wealthy are going to abandon one quarter of the world’s income? Do you really think the wealthy are going to flea wealthy countries in preference for underdeveloped or more totalitarian states or more socially restricted countries simply because of tax rates? If that were the case, Europe should have been abandoned by the wealthy long ago. It is a myth Billy T. The wealthy are not going to abandon anything as long as there is a buck to make or power to be attained. Wal-Mart and the owners of Wal-Mart are not going to pick up and leave just because the US government raises their taxes. If your excuse had merit those socialist, commie, fascist Swedes would not be growing their economy several multiples faster than we have in the US with our extremely low income taxes on the wealthiest among us.
 
Back
Top