The Etp Model Has Been Empirically Confirmed

Status
Not open for further replies.
at this moment the front month, CLX5 , is setting a bottom and getting ready to move to it's next range of 55-60 area. the dec' 22 is at 58.01
front month, CBX15 is doing the same. the CBZ22[dec'22] is at 62.58 already.

there will be volatility from expiration.
if one can cover the margin requirements, it's time to buy next month contracts now[dec'15] it also maybe wise to buy the dec'22 contract now. all for CL
i would mainly stay on the buy side of these contracts.
 
Last edited:
PHYSICS TRUMPS ECONOMICS

"Last time I looked oil was $46/ barrel. If the consumer is willing, they are certainly not willing with any great great enthusiasm! That is 54% off its high; sort of a KMart blue light special, buy one, get two for the same price. In actuality it is not what the consumer is willing to pay, it is what the economy can afford to pay. That is no longer $100 oil.

The central banks intended to "kick start" the economy by pushing a lot of currency into it. It might have worked if the resources had been available, but according to our energy model oil was no longer able to support such an effort. By 2012 petroleum had reached its energy half way point, and the non energy producing sector to the economy could no longer grow. That currency then went into the energy producing sector of the economy, oil production grew faster than the rest of the economy could absorb it, so we ended up with $45 oil.

That's what happens when the wrong metric is used to evaluate one, if not the most, important commodity in the economy. Even a Roman peasant knew that silver content was more important than the size of the coin! Using exclusively a bunch of economists to run the economy is like turning brain surgery over to the plumbers!

So now we are in a perfect Catch 22 situation. At $46/ barrel there is not a producer in the world that has the cash flow to replace the reserves that they are extracting, and probably at least a third of them are losing money on every barrel they produce. They are living on borrowed funds. If the central banks shut off the money spigot oil production collapses, and the economy goes down the tubes. If they don't, the price of oil keeps going down, producers collapse, and the economy goes down the tubes.

Nice mess!!"

~BWHill

Yep. Catch-22. The price of oil cannot rise.

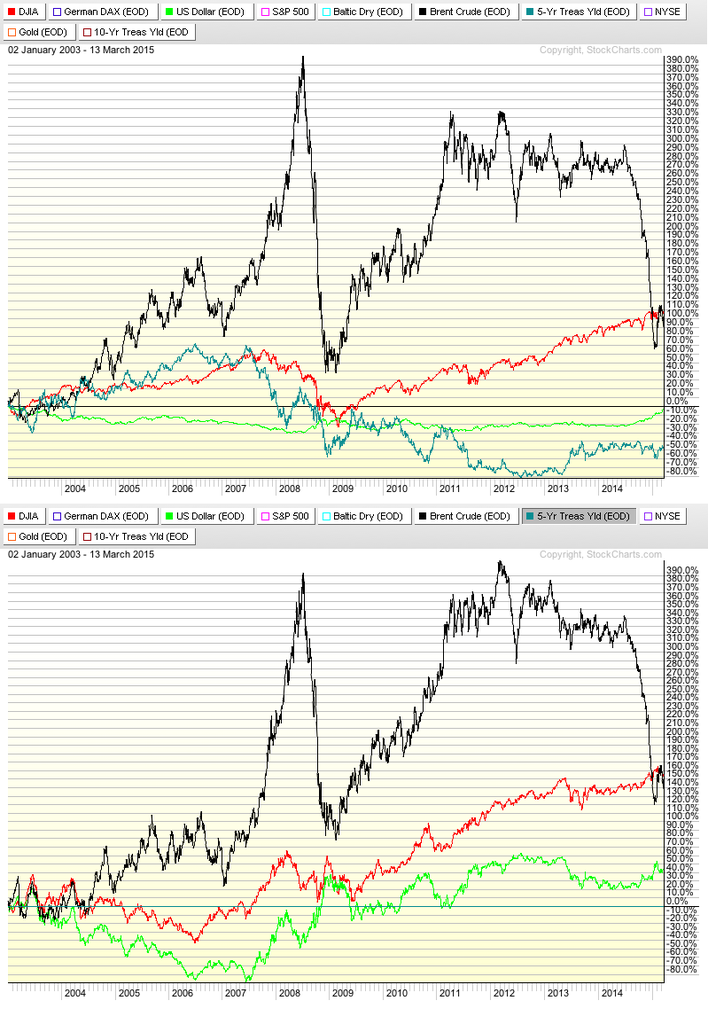
Here are a couple of charts illustrating the influence of central bank policy on the price of oil:


The top chart shows the oil price. The bottom chart shows the oil price relative to short term interest rates. When seen this way, the highest price ever paid for oil was not in 2008. It was really in 2012, exactly where the Etp curves intersect! Wild huh?

The world economy is a gigantic thermodynamic system that runs on oil. Starting with the 2008 bailout, and continuing through endless QE, ZIRP, NIRP, and Operation Twist, all the central banks have managed to do is just temporarily prop up the price of oil. But there is nothing more that the central banks can do now, so the game is over.

The second law of thermodynamics cannot be violated. Physics trumps economics every time. Especially the last time.


---Futilitist:cool:
 
Last edited:
Once again, for readability.*

PHYSICS TRUMPS ECONOMICS

"Last time I looked oil was 46 dollars per barrel. If the consumer is willing, they are certainly not willing with any great great enthusiasm! That is 54% off its high; sort of a KMart blue light special, buy one, get two for the same price. In actuality it is not what the consumer is willing to pay, it is what the economy can afford to pay. That is no longer 100 dollar oil.

*The central banks intended to "kick start" the economy by pushing a lot of currency into it. It might have worked if the resources had been available, but according to our energy model oil was no longer able to support such an effort. By 2012 petroleum had reached its energy half way point, and the non energy producing sector to the economy could no longer grow. That currency then went into the energy producing sector of the economy, oil production grew faster than the rest of the economy could absorb it, so we ended up with 45 dollar oil.*

That's what happens when the wrong metric is used to evaluate one, if not the most, important commodity in the economy. Even a Roman peasant knew that silver content was more important than the size of the coin! Using exclusively a bunch of economists to run the economy is like turning brain surgery over to the plumbers!

So now we are in a perfect Catch 22 situation. At 46 dollars per barrel there is not a producer in the world that has the cash flow to replace the reserves that they are extracting, and probably at least a third of them are losing money on every barrel they produce. They are living on borrowed funds. If the central banks shut off the money spigot oil production collapses, and the economy goes down the tubes. If they don't, the price of oil keeps going down, producers collapse, and the economy goes down the tubes.

Nice mess!!"

~BWHill

Yep. Catch-22. The price of oil cannot rise.

Here are a couple of charts illustrating the influence of central bank policy on the price of oil:


The top chart shows the oil price. The bottom chart shows the oil price relative to short term interest rates. When seen this way, the highest price ever paid for oil was not in 2008. It was really in 2012, exactly where the Etp curves intersect! Wild huh?

The world economy is a gigantic thermodynamic system that runs on oil. Starting with the 2008 bailout, and continuing through endless QE, ZIRP, NIRP, and Operation Twist, all the central banks have managed to do is just temporarily prop up the price of oil. But there is nothing more that the central banks can do now, so the game is over.

The second law of thermodynamics cannot be violated. Physics trumps economics every time. Especially the last time.


---Futilitist$:cool:

* The inability to use a dollar sign $ makes it very hard to discuss the topic of this thread $. When I first made this post, this persistent bug made an entire paragraph unreadable, necessitating this repost.
 
Last edited:
... In actuality it {$46/brl} is not what the consumer is willing to pay, it is what the economy can afford to pay. That is no longer 100 dollar oil.
Nonsense!
That is all he NEEDS to pay, thanks to the oil glut, and the saving is helping him continue to consume, despite his salary on average falling in purchasing power.
... The world economy is a gigantic thermodynamic system* ... Physics trumps economics every time.
No this show even more clearly than first quote above, that you have little understanding of thermodynamics or physics and even less of economics, which is more complex, without rigid rules (certainly not from thermodynamics) as economics is largely psychologically driven.

Physics applies to physical items and energy flows, but say NOTHING about what prices are associated with either.
Please again go away for a few years. This is a science forum, not a dog and pony show for egotists.

The world is a thermodynamic system - quasi closed, as net solar energy input is nearly same as IR losses.

... The price of oil cannot rise
In your first tirade here you said it must rise. That was true in the long run. You are going from "silly" to "stupid" in your second sciforums appearance.
 
Last edited:
Nonsense!
That is all he NEEDS to pay, thanks to the oil glut, and the saving is helping him continue to consume, despite his salary on average falling in purchasing power.No this show even more clearly than first quote above, that you have little understanding of thermodynamics or physics and even less of economics, which is more complex, without rigid rules as largely psychologically driven.

Physics applies to physical items and energy flows, but say NOTHING about what price are associated with either.
Please again go away for a few years. This is a science forum, not a dog and pony show for egotists.

The world is a thermodynamic system - quasi closed, as solar energy input is nearly same as IR losses.

Quite - could not put it better myself.
 
exchemist said:
Quite - could not put it better myself.
That is probably true. But instead of just popping in to ratify the posts of others, why not take some time to answer these important questions you keep dodging:

exchemist,

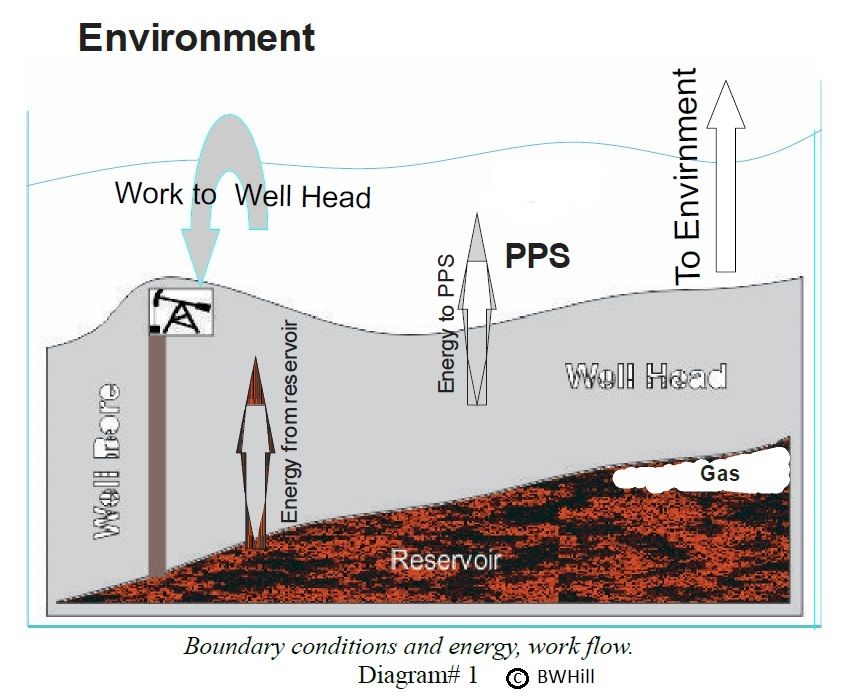
Boundary%20conditions_zpse1brybjr.jpg

Crude oil is used primarily as an energy source; its other uses have only minor commercial value. To be an energy source it must therefore be capable of delivering sufficient energy to support its own production process (extraction, processing and distribution); otherwise it would become an energy sink, as opposed to a source. The Total Production Energy ($$E_{TP}$$) must therefore be equal to, or less than EG, its specific exergy. To determine values for $$E_{TP}$$ the total crude oil production system is analyzed by defining it as three nested Control Volumes within the environment. The three Control Volumes (where a control volume differs from a closed system because it allows energy and mass to pass through it's boundaries) are the reservoir, the well head, and the Petroleum Production System (PPS). The PPS is where the energy that comes from the well head is converted into the work required to extract the oil. The PPS is an area which is distributed within, and throughout the environment. It is where the goods and services needed for the production process originate. This boundary make-up allows other energy, and mass transfers to be considered as exchanges, such as natural gas used in refining, electricity used in well pumping, or water used for reservoir injection.
So, exchemist, why are the three nested control volumes used in the Etp model supposedly invalid?

and...

Oil production and oil price are closely related to each other. If you build an oil depletion/price forecasting model based on only on the cumulative production history of oil and the second law of thermodynamics, and then you back check the model against actual historical oil price data over 44 years and you get a correlation coefficient of .965, you can safely infer that it is statistically significant.

How can you keep claiming that the Etp model is impossible when the Etp model clearly works so well?

Nonsense! That is all he NEEDS to pay, thanks to the oil glut, and the saving is helping him continue to consume, despite his salary on average falling in purchasing power.
"Stick with it, and stay confused as to why a 55% reduction in price only produced a 1 to 2% increase in demand. Plus, most of that 1 to 2% was oil that was put into storage. The EIA considers oil that was purchased, and put into storage as consumed. There may have been no increase in consumed product at all, as world inventories are at historic highs. That increased production was accomplished by the accumulation of a gigantic amount of debt.

Petroleum is no longer responding to declining prices. The energy delivered from a unit of petroleum has fallen to the point that it is only powering economic activity for the general economy equal to its cost. A prolonged price increase in 2016 can not exceed about 60 dollars. About 50 dollars in 2017, and 40 dollars in 2018.

The oil age is ending~"

~BWHill
No this show even more clearly than first quote above, that you have little understanding of thermodynamics or physics and even less of economics, which is more complex, without rigid rules as largely psychologically driven.
The world economy is a gigantic thermodynamic system. All the psychologically driven complexity in the world cannot defy the laws of physics.
Physics applies to physical items and energy flows, but say NOTHING about what price are associated with either.
Oil production and oil price are closely related to each other. If you build an oil depletion/price forecasting model based on only on the cumulative production history of oil and the second law of thermodynamics, and then you back check the model against actual historical oil price data over 44 years and you get a correlation coefficient of .965, you can safely infer that it is statistically significant.

The Etp model is valid.
Please again go away for a few years.
We don't have a few years left before the internet goes down.
This is a science forum, not a dog and pony show.
Ha ha. This is not a real science forum.
The world is a thermodynamic system - quasi closed, as net solar energy input is nearly same as IR losses.
That is true. But you are attempting to jump the shark. We were clearly talking about the world economic system, not the world. The world economy is an open thermodynamic system that runs mostly on oil. As such, parts of that system can be modeled thermodynamically. And this is all a bit of a red herring because the Etp model does not even attempt to model the whole world economy, just the rising entropy production in the world oil production system.
In your first tirade here you said it must rise. That was true in the long run. You are going from "silly" to "stupid" in your second sciforums appearance.
I said it would rise until it couldn't rise any more. I was right. At the time, I had yet to see a thermodynamic model like the Etp model. This has helped to fine tune my forecasts. I am getting better. You are the one going from silly to stupid.


---Futilitist:cool:
 
Last edited:
PHYSICS TRUMPS ECONOMICS

"Last time I looked oil was $46/ barrel. If the consumer is willing, they are certainly not willing with any great great enthusiasm! That is 54% off its high; sort of a KMart blue light special, buy one, get two for the same price. In actuality it is not what the consumer is willing to pay, it is what the economy can afford to pay. That is no longer $100 oil.

The central banks intended to "kick start" the economy by pushing a lot of currency into it. It might have worked if the resources had been available, but according to our energy model oil was no longer able to support such an effort. By 2012 petroleum had reached its energy half way point, and the non energy producing sector to the economy could no longer grow. That currency then went into the energy producing sector of the economy, oil production grew faster than the rest of the economy could absorb it, so we ended up with $45 oil.

That's what happens when the wrong metric is used to evaluate one, if not the most, important commodity in the economy. Even a Roman peasant knew that silver content was more important than the size of the coin! Using exclusively a bunch of economists to run the economy is like turning brain surgery over to the plumbers!

So now we are in a perfect Catch 22 situation. At $46/ barrel there is not a producer in the world that has the cash flow to replace the reserves that they are extracting, and probably at least a third of them are losing money on every barrel they produce. They are living on borrowed funds. If the central banks shut off the money spigot oil production collapses, and the economy goes down the tubes. If they don't, the price of oil keeps going down, producers collapse, and the economy goes down the tubes.

Nice mess!!"

~BWHill

Yep. Catch-22. The price of oil cannot rise.

Here are a couple of charts illustrating the influence of central bank policy on the price of oil:


The top chart shows the oil price. The bottom chart shows the oil price relative to short term interest rates. When seen this way, the highest price ever paid for oil was not in 2008. It was really in 2012, exactly where the Etp curves intersect! Wild huh?

The world economy is a gigantic thermodynamic system that runs on oil. Starting with the 2008 bailout, and continuing through endless QE, ZIRP, NIRP, and Operation Twist, all the central banks have managed to do is just temporarily prop up the price of oil. But there is nothing more that the central banks can do now, so the game is over.

The second law of thermodynamics cannot be violated. Physics trumps economics every time. Especially the last time.


---Futilitist:cool:
http://www.sciforums.com/threads/th...rically-confirmed.152487/page-55#post-3332582
 
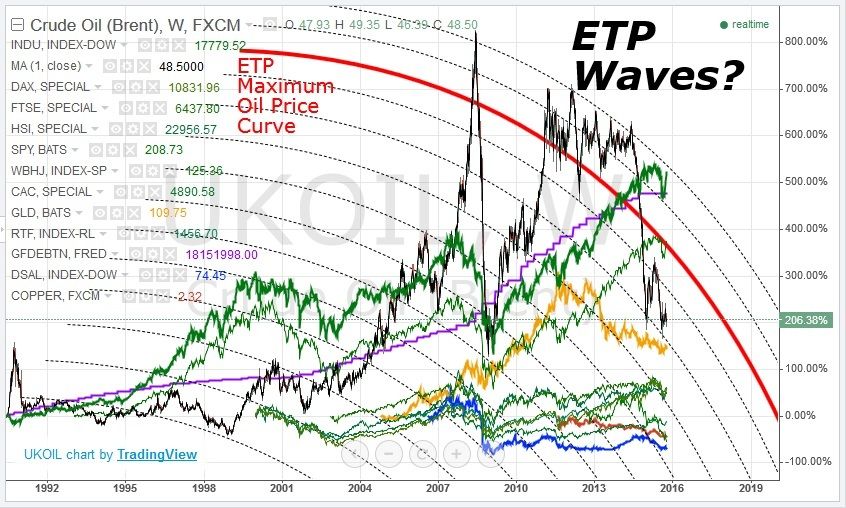
ETP UPDATE

ETP%20Waves%203_zpsvkxak2ai.jpg


I made this chart to see if the shape of the ETP maximum oil price curve could be detected in other parts of the economy. The green lines are various world stock markets, with the Dow being represented by the thickest green line. The yellow line is gold, the brown line is copper, and the blue line is aluminum. The purple line is federal government debt. These are all displayed relative to the oil price.

I think the effect of civilization reaching the thermodynamic maximum oil price can be clearly seen in the various indicators. The markets seem to follow echos of the ETP curve, like grooves in a record! I am calling these "ETP Waves". They are another empirical proof of the validity of the ETP model.


---Futilitist:cool:
except your own chart is clearly showing the opposite.
:) shrugs.
another funny thing, your chart says " maximum." except your own chart shows it already moved past your maximum.
 
at this moment the front month, CLX5 , is setting a bottom and getting ready to move to it's next range of 55-60 area. the dec' 22 is at 58.01
front month, CBX15 is doing the same. the CBZ22[dec'22] is at 62.58 already.

there will be volatility from expiration.
if one can cover the margin requirements, it's time to buy next month contracts now[dec'15] it also maybe wise to buy the dec'22 contract now. all for CL
i would mainly stay on the buy side of these contracts.
~krash661, Oct 2, 2015

Good call there, krash.

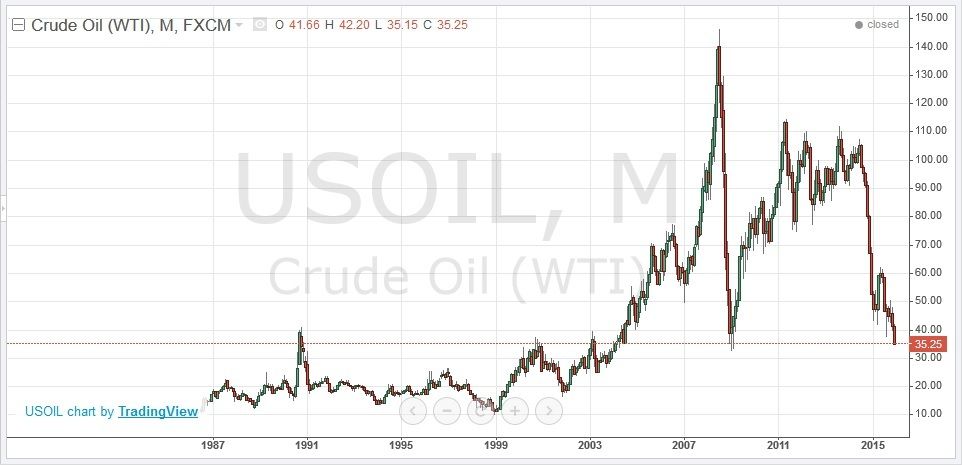
On the other hand, here is what I predicted:

"I would guess that the price of oil will soon (before 2016) drop to somewhere in the low 30s or possibly even lower."
~Futilitist, Aug 7, 2015

And here is what actually happened so far:
the%20latest%20Etp%20update%201_zpsifwbvhrz.jpg

Amazing!

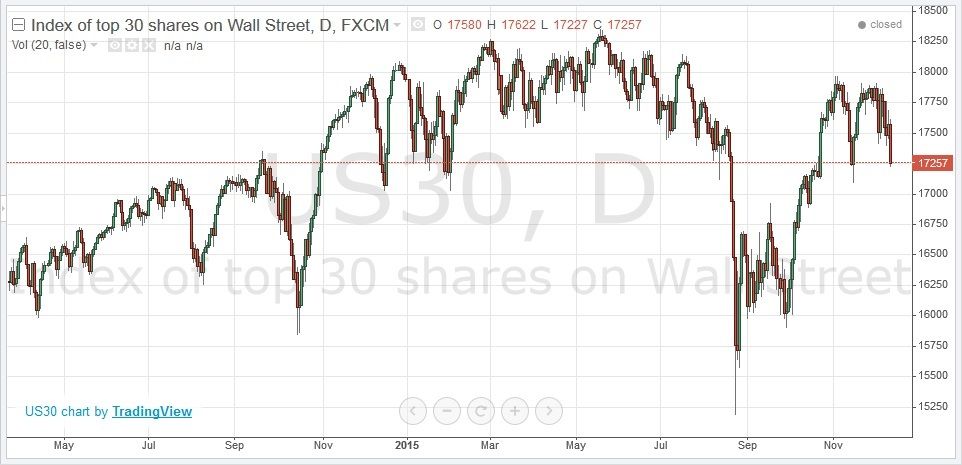
I also predicted that the stock market would crash before the end of this year. That hasn't officially happened yet, but it is only December 13 and the markets are not looking good:
the%20latest%20Etp%20update%202_zpsokd0gkwp.jpg


---Futilitist:cool:
 
yes-- i am sure.
it always moves lower during winter seasons. after expiration, i'm sure you will start to see it move higher, back up to that 40-50 area, over the next 3 months after january to march.
also, this is all the aftermath[deflating from the 08 crash], remember when humanity was going to collapse and oil shot up with gold?
look where oil prices were in 2000 to 2003, before it was recognized an econ collapse was being discussed. so hence oil is now at its core value without all that speculation pricing involved. and also obama is leaving office. also, i would assume when those war talks start again, it probably will move back to that 40-50 range again. even without all that, oil will move back up to 40-50 area and stabilize. that 40-50 area will be the value for some time, probably at least for a year or so when it does move there. in a sense what ever you are preaching for, this is nothing new when it comes to econ with decades of data. overall, if i am wrong--i am wrong. it will not be the first time i was wrong. i also have skin in the game as it is refereed too, i am not just some jerk-off that has never even done a trade themselves pushing some kind of mathematics--it is referred to as experience--you should try it sometime.
"I would guess that the price of oil will soon (before 2016) drop to somewhere in the low 30s or possibly even lower."
~Futilitist, Aug 7, 2015
And here is what actually happened so far:
:) how much money did you make?-- oh, none?
all i know is my oil contract margin cost shrunk, that only occurs when you make money--otherwise your account will be blown out from losing money and having to be margin called. ever hear of that term(margin call) ?

also-- i love your homeowner education and charts--cute.
those investment commercials can sure make one look like they know something, huh?

i am actually shocked that you have not started your own trading system package-- like all of the other so-called professionals do--except the actual professionals simply open an account and simply trade and make money. the ones whom do these pathetic trading systems will not do such a thing, especially with their own money.
 
Last edited:
i do wish at times, that people would speak from experience like what was required in the past. not just on this subject, but in general..
 
yes-- i am sure.
it always moves lower during winter seasons. after expiration, i'm sure you will start to see it move higher, back up to that 40-50 area, over the next 3 months after january to march.
also, this is all the aftermath[deflating from the 08 crash], remember when humanity was going to collapse and oil shot up with gold?
look where oil prices were in 2000 to 2003, before it was recognized an econ collapse was being discussed. so hence oil is now at its core value without all that speculation pricing involved. and also obama is leaving office. also, i would assume when those war talks start again, it probably will move back to that 40-50 range again. even without all that, oil will move back up to 40-50 area and stabilize. that 40-50 area will be the value for some time, probably at least for a year or so when it does move there. in a sense what ever you are preaching for, this is nothing new when it comes to econ with decades of data. overall, if i am wrong--i am wrong. it will not be the first time i was wrong. i also have skin in the game as it is refereed too, i am not just some jerk-off that has never even done a trade themselves pushing some kind of mathematics--it is referred to as experience--you should try it sometime.

:) how much money did you make?-- oh, none?
all i know is my oil contract margin cost shrunk, that only occurs when you make money--otherwise your account will be blown out from losing money and having to be margin called. ever hear of that term(margin call) ?

also-- i love your homeowner education and charts--cute.
those investment commercials can sure make one look like they know something, huh?

i am actually shocked that you have not started your own trading system package-- like all of the other so-called professionals do--except the actual professionals simply open an account and simply trade and make money. the ones whom do these pathetic trading systems will not do such a thing, especially with their own money.

Yeah there's a slowdown due to China getting real, but we all knew that was coming. Fute (a.k.a. "Asspain" on the Science Forum) thinks (hopes?) the end of civilisation is nigh, but there is no evidence at all that this is so. What I think we are having to get used to is the world economy depending on what is happening in a new country - China. We are used to predicting how the economic cycle will go on the basis of the US, but now it is no longer quite so simple.

But none of this remotely suggests any kind of apocalypse of the sort Fute/Asspain hankers after.
this whole scenario is only the global economy creating stability for itself. on this scale scenarios take around 10-12 years to iron itself out. :) but by that time another recession occurs. ( :) shrugs). for long term trading which is termed as investing(usually a year or more for the trade), you have to play the cycles on scales of decades. most who trade in these long term time frames, forget about the whole picture and only focus on right now. which is not wrong-- but only should be used during short term trades. global econ and the markets are just as ffucked up as anything else. if i made money, that means somebody lost money and vise-versa. it is all a teeter totter-- credit being the main driving force. the credit markets are nothing more than the infamous hot potato game.

edit--
china is also nothing special. china only grew from(mainly) USA's consumption--due to the manufacturing brought to them by the USA manufacturers, only because they do not have labor laws as we do(think about changing laws as they build their econ). it was not that long ago that china was still rice farms. looking into the past, other countries have became emerging markets from the same thing-- but before USA manufacturers moved to china. remember seeing " made in taiwan" and such ? the question is what will happen to china when manufacturers can find cheaper manufacturing cost from another country(including freight shipping cost)? past data can help with this answer. also think about all that debt they hold. they only have a choice of giving it to someone else or hold on to it and collapse their country. debt never, never goes away--it is only moved and increasing(hot potato game) so the question leads to what happens to humanity when that debt, with it's continuous increasing, can no longer be passed.

edit 2--
these are outdated, but may help with giving one an idea of it all
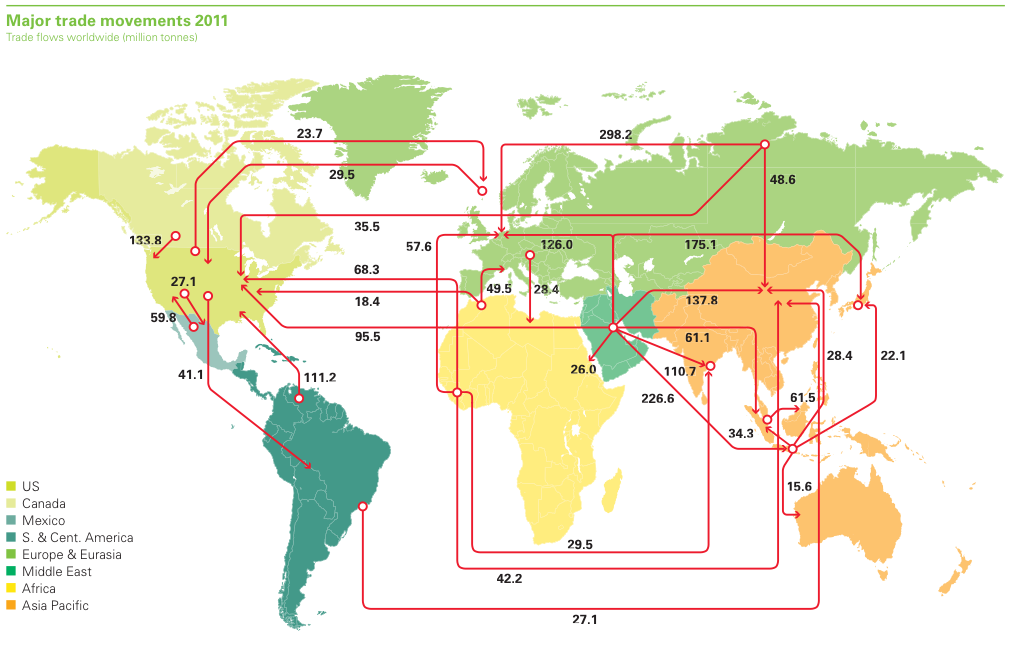
this one is the oil imports on a global scale:
oil-import-export-map.png

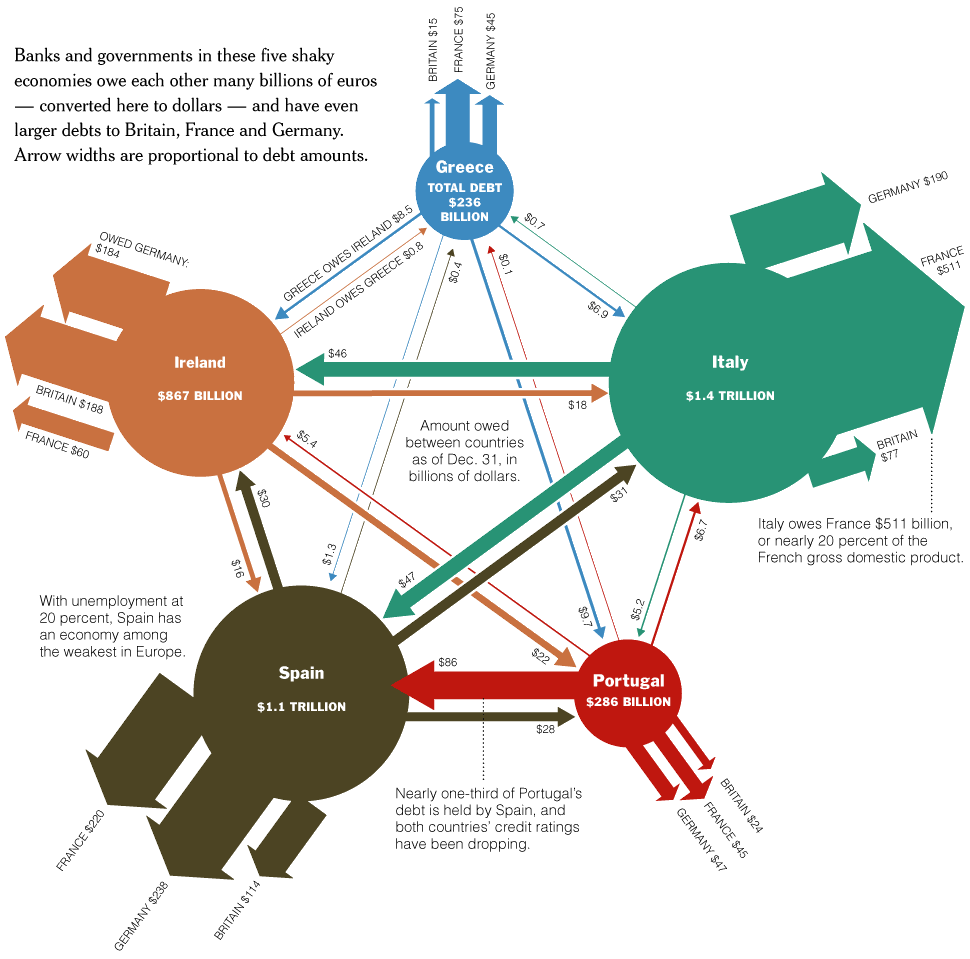
this one is the debt holdings on a global scale:
02marsh-image-custom1-v3.gif

us-debt.jpg

US_TICS0211_SC.gif
 
Last edited:
12/22/2015
11:49 am

West Texas Intermediate Crude - $36.20
Brent Crude - $36.20

Spread - $0.00!!!

Wow.


---Futilitist:cool:
 
12/22/2015
11:49 am

West Texas Intermediate Crude - $36.20
Brent Crude - $36.20

Spread - $0.00!!!

Wow.


---Futilitist:cool:
https://www.linkedin.com/pulse/activities/michael-krash 0_120oSX7Q0pdtikCoQn_2hI?trk=nav_responsive_sub_nav_yourupdates
  • LikeLike Michael Krash's post
  • Commentcomment on Michael Krash's post
  • Shareshare Michael Krash's post
11 comment.
  1. 0772ec8.jpg

    21h
    Michael Krash
    i just added to my CLH16 long position-- my average price is now 36.80-- i will add more if it moves lower than my average price. i now also have a long position in CLZ6 at 42.25.
    i will still add to my long position (clh6) if it goes to 34-32 area-- same for my clz6 position.

    Michael Krash commented on this
    0772ec8.jpg

    Michael Krash
    While I am standing still-- I prefer the stillness here.

    i am thinking of shorting the eur/usd at 1.10 area.
    Michael Krash 1h
    1. and pairs trade it with the DXH6 at 98.10-- the eur i will short to .085 area and the DX to 98.90 area-- i will let everyone know when i get in.
      i was filled with a small short at 1.097-- i will add more when it moves up to 1.10. i am not filled on my DX yet.
    2. Michael Krash 7m
      i had too adjust my DX entry-- i got in on the buy side at 98.14
 
Last edited:
Status
Not open for further replies.
Back
Top