Oh, and...


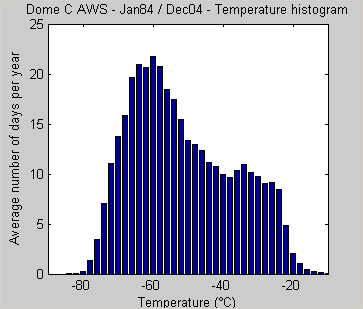
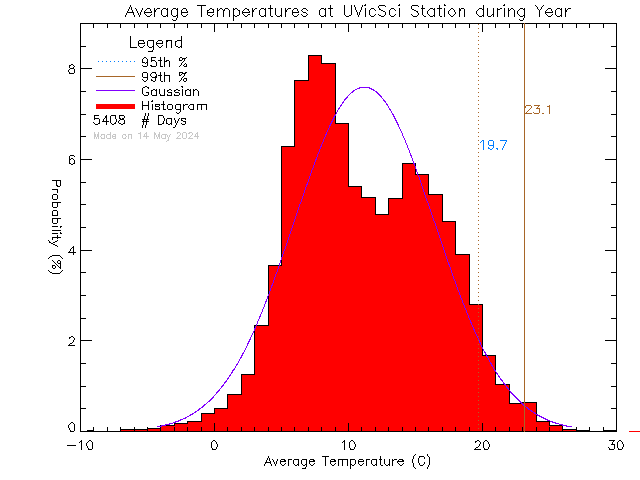
Seeing as how I doubt that you understand what you're looking at, these are histograms.
They show two things.
1. Temperature measured at the same location over an extended period of time (for example, sampled daily for a period of years) displays a bimodal normal distribution (depending on the strength of the seasonal signal).
2. Temperature measured at the same place on the same day over a period of years displays a normal distribution.
It might be predictable, and it might be cyclic, but it also has a random component if your sample size is big enough.


