One of the biggest climate change threats -- Rain

Yes, Quantum Quack, you could say that "the stats are still damning..."

paranoia?

file?

I Posted nothing about any paranoia.
I Posted nothing about any file.

I simply responded to your Post #110 :


and Post #115 by iceaura :

I could have easily claimed to have missed out on writing a second "1" in the number 114 and entered 14 incorrectly. A typo as Iceaura has suggested but no, I made a serious mistake and I apologize for it. I admit it, I own it and I learn from it.. again thanks....
 
Frankly, I would rather be called out on a mistake even if done with hostility than to have the mistake over looked or put aside... so thank you for your effort...
Perhaps you could have a go at how Schmelzer did a duck and dodge on the stats, strawmaning to famine and population numbers instead... you know ... for the sake of honest discussion...

Frankly, Quantum Quack, neither was I intending any "hostility" toward you, nor was I "having a go" at you in my Post #112.
To be completely Honest, I would not have even made any Post if not for the fact that you had stated "a three fold increase in extreme rainfall events over 14 years" in both Posts #107 and #110.
Seeing that it was you that introduced the "During 1901-2015, there has been a three-fold rise in widespread extreme rainfall events" in your Post #104.
I only made that Post after you asked : "Do you deny this stat?" after stating it as "14 years" twice.

I could have easily claimed to have missed out on writing a second "1" in the number 114 and entered 14 incorrectly. A typo as Iceaura has suggested but no, I made a serious mistake and I apologize for it. I admit it, I own it and I learn from it.. again thanks....

Grok'd!
Also kudos, Quantum Quack, for admitting your error and apologizing (when there really was no need to apologize).

Also, and again being both Frank and Honest, I would not have made Post #116 if it were not for Post #115.

Again, I intended no hostility toward you, Quantum Quack.
 
Last edited:
Note to any one reading this Thread :
For the sake of honest discussion, it should be apparent that Quantum Quack meant to type the number "65", but through a simple typo, instead typed the number "14" by mistake, twice, in Post #107 and again in Post #110.
There can be no denying any of the reality involved in making such a simple error as it is apparent that the numbers "1" and "4" are very close to and very similar to the numbers "6" and "5" on most keyboards and number pads.
Completely and utterly full of shit.
And that kind of post is what we have learned to expect from that crowd.

In intent, in implication, in motive, in purpose, completely typical. Misread, misrepresent, launch irrelevant personal insult and slander and innuendo based on misrepresentation - and nothing else. No contribution to the thread, the discussion, anything of the kind. Not even in response to the quoted post, which contained this open invitation:
And if really curious, and wanting to make a stronger argument, they could look up the trend and acceleration. How much of that 300% happened in the last 20 years of the 65? If more than a third, evidence of an emergency incoming. If less than a quarter, good news.

These people are not ok. There's something gone badly wrong with the way they think.
They cannot participate in a discussion of anything that the US Republican Party has taken a position on, such as the research findings on AGW - the capability, dependent as it is on memory and attention to physical fact, has been crippled in them.

And so the political reality in the US is that nothing can be done about AGW - slowing it, preparing for its likely effects such as the OP introduces, even describing it accurately - until the Republican Party has been removed from power and its media feeds ghettoed.
 
Last edited:
Frankly, Quantum Quack, neither was I intending any "hostility" toward you, nor was I "having a go" at you in my Post #112.
To be completely Honest, I would not have even made any Post if not for the fact that you had stated "a three fold increase in extreme rainfall events over 14 years" in both Posts #107 and #110.
Seeing that it was you that introduced the "During 1901-2015, there has been a three-fold rise in widespread extreme rainfall events" in your Post #104.
I only made that Post after you asked : "Do you deny this stat?" after stating it as "14 years" twice.


Grok'd!
Also kudos, Quantum Quack, for admitting your error and apologizing (when there really was no need to apologize).

Also, and again being both Frank and Honest, I would not have made Post #116 if it were not for Post #115.

Again, I intended no hostility toward you, Quantum Quack.
Accepted... thanks.
It is a hot issue.
It is an incredibly vexatious issue.
It is also an incredibly sad issue.. ( thinking of all the grandchildren including my own)
Paranoia is to be anticipated on ALL sides of the debate.
Mistaken impressions, interpretations and the "apparent" loss of good will...have to be contended with.
======
on topic:
Yes Iceaura has a point. The 300% increase in rain events just for that region alone needs to be further scrutinized to find out the extent of the acceleration (if any)

IMO , ever since the catastrophic flooding of Iran in April 2009 there appears to be a significant uptick in climate change events. This thought has been consolidated by the fact that the world has this year ( 2019) recorded it's hottest July on record.
Increased ocean evaporation and precipitation rates will definitely be the outcome.
Much of the equatorial regions will experience dramatic increases in monsoonal conditions to the point where living in these regions becomes untenable with out major, rapid and expensive adaptation..

What is most daunting is the fact that here in Melbourne Australia our local winter has for the first time been obviously too warm ( on average) to the average person on the street ( common comment by people you meet).

What all this means to me is that because locally the last 4 consecutive months have consistently had above average ( by a few deg c) max temperatures that a new and accelerating trend has developed. One that suggests that the threshold for possible climate change reversal or stability has been passed.
Our Winter has become the Autumn we missed and the coming Spring will most likely be the Summer we have yet to see.,..and the Summer ... well... that's another story...
Perhaps this is just me being paranoid?

Yet the raw un-opinioned climate data is what it is....
 
Last edited:
July was the hottest month ever recorded on Earth.

That's the word from the National Oceanic and Atmospheric Administration (NOAA), which tallied up global land and sea temperature recordings from 2019's seventh month and compared them to its 140-year data set, stretching back to 1880. The global average temperature for the month was 1.71 degrees Fahrenheit (0.95 degrees Celsius) above the 20th century average of 60.4 F (15.8 C). It was 0.05 F (0.03 C) warmer than the previous record, set in July 2016.
https://www.livescience.com/july-hottest-month-ever-record-climate-change.html
Just about to post an article on that...
Let me also add that Australia has just experienced its driest July ever recorded.

I wonder how many more of these so called alarmist issues will need to be raised before some realize that they are becoming the norm. Or will they then automatically play an Ostrich game?upload_2019-8-16_10-47-22.jpeg
 
Typical alarmism.
the infrastructure should be actually
this is 1 single events of hundreds of events of houses being blown up by old leaking gas lines that the companys wont replace and the government wont force them to replace.


Typical alarmism.

Nearly 40 homes catch fire after natural gas tragedy north of Boston; 1 dead
https://www.usatoday.com/story/news...ns-massachusetts-leave-homes-fire/1295706002/
"a problem with a gas line that feeds that area"

portland

have you not heard of the Flint water crisis ?

https://en.wikipedia.org/wiki/Flint_water_crisis
https://en.wikipedia.org/wiki/Flint...aging_infrastructure_problems_in_other_cities

Lead poisoning and aging infrastructure problems in other cities
An investigative report by Reuters released December 19, 2016 found nearly 3,000 areas in the United States with lead contamination rates at least double those in Flint.[358] The Trump Administration blocked publishing a federal health study on the nationwide water-contamination crisis.[359]

The water disaster called attention to the problem of aging and seriously neglected water infrastructure nationwide.[360][361]


The Flint crisis recalled recent lead contamination crises in the tap water in various cities, such as the lead contamination in Washington, D.C. drinking water (2001), Columbia, South Carolina (2005); Durham and Greenville, North Carolina (2006); Jackson, Mississippi (2015); and Sebring, Ohio (2015). The New York Times notes, "Although Congress banned lead water pipes 30 years ago, between 3.3 million and 10 million older ones remain, primed to leach lead into tap water by forces as simple as jostling during repairs or a change in water chemistry." Inadequate regulation was cited as one reason for unsafe lead levels in tap water and "efforts to address shortcomings often encounter push-back from industries like agriculture and mining that fear cost increases, and from politicians ideologically opposed to regulation."


The crisis called attention to a "resource gap" for water regulators. The annual budget of the EPA's drinking water office declined 15% from 2006 to 2015, with the office losing over 10% of employees, and the Association of State Drinking Water Administrators reported in 2013 that "federal officials had slashed drinking-water grants, 17 states had cut drinking-water budgets by more than a fifth, and 27 had cut spending on full-time employees," with "serious implications for states' ability to protect public health."[361]

In the aftermath of the water crisis, it was noted that elevated blood-lead levels in children are found in many cities across Michigan, including Detroit, Grand Rapids, Muskegon, and Adrian. Although statewide childhood lead-poisoning rates have dramatically declined since the removal of lead from gasoline, certain areas of the state (particularly low-income areas with older housing stock) continue to experience lead poisoning, mostly from lead paint in homes built before 1978 and lead residue in dust and soil. Lead abatement efforts are slow.[362]


Typical alarmism.

If a simple 5% increase would lead to catastrophic outcomes, the infrastructure should be actually in an extremely catastrophic state.

well im sure all those critically injured people and the familys of all the dead and permanently disabled will be glad to hear you think they have not suffered enough.

https://en.wikipedia.org/wiki/Hurricane_Katrina


hurricane what ?! nope never heard of it !
doesn't exist !


Last edited:
The reality of AGW is not a "side" of a debate.
true... but it is the center of what is being debated, unless of course you forbid debate and wish to force people to believe in something that they are not emotionally prepared to believe in...
 
true... but it is the center of what is being debated, unless of course you forbid debate and wish to force people to believe in something that they are not emotionally prepared to believe in...

how many people are emotionally prepared for divorce and custody battles for their children ?

is it better to just let the parent think the divorce is going to go without any problems and that there wont be a custody battle ?
... and not to try and tell them what a nasty custody battle is like ?(etc et-all)

should the lawyers and social workers and state child protection agency's keep their mouths shut and just watch from the side lines ?

what if the children are not emotionally ready for the divorce ?

remember the air line regulation change banning little bottles of shampoo and drink bottles
people were not ready for that
people didn't want it
but they forced it on them anyway
all over the world

there was no 2nd amendment rights protests about having the right to carry small drink bottles and shampoo on holiday...

Liberty (usa-political 'liberalism'[government law minimalists]) has a price, just as freedom is not free
I understand what you are posting... but...
My point remains valid... you can't force a belief on any one.
Article 18 UDHR: Article 18. Everyone has the right to freedom of thought, conscience and religion; this right includes freedom to change his religion or belief, and freedom, either alone or in community with others and in public or private, to manifest his religion or belief in teaching, practice, worship and observance.

was the world's acknowledgement of this human nature fact. after the catastrophe of ww2 (1948)
Forcing a belief only leads to push back , deception ( lies), animosity and denial....and ... war
 
Last edited:
Completely and utterly full of ...power and its media feeds ghettoed.
Off Topic ad-hominems...not open for any true discussion...baiting/trolling...
I refuse to participate in any argument, especially with anyone who chooses to utilize Logical Fallacies.

Ands if really curious, and wanting to make a stronger argument, they could look up the trend and acceleration. How much of that 300% happened in the last 20 years of the 65? If more than a third, evidence of an emergency incoming. If less than a quarter, good news.
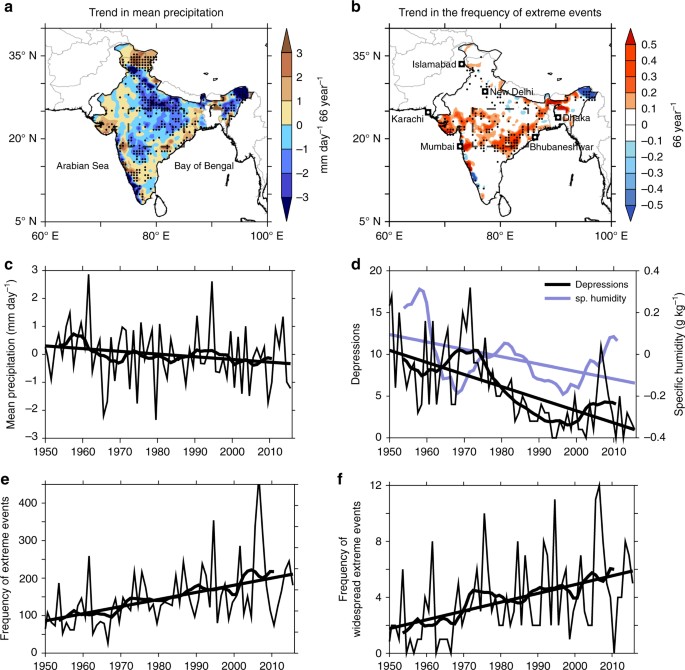
However, if you are truly interested in the issue and really care to discuss "the trend and acceleration", you can "look" at the research that was referenced for the wikipedia.org article that Quantum Quack quoted in his Post #104 at this Link : https://www.nature.com/articles/s41467-017-00744-9

" A threefold rise in widespread extreme rain events over central India
Abstract (partial)
Socioeconomic challenges continue to mount for half a billion residents of central India because of a decline in the total rainfall and a concurrent rise in the magnitude and frequency of extreme rainfall events. Alongside a weakening monsoon circulation, the locally available moisture and the frequency of moisture-laden depressions from the Bay of Bengal have also declined. Here we show that despite these negative trends, there is a threefold increase in widespread extreme rain events over central India during 1950–2015.*

Fig. 1

Trends in summer mean and extreme precipitation during 1950–2015. Observed trend in summer a mean precipitation anomalies (mm day−1 66 year−1) and b the frequency (66 year−1) of extreme precipitation events (precipitation ≥ 150 mm day−1). Mean precipitation for the season is 8.1 mm day−1. Time series of c of precipitation (mm day−1), d specific humidity (1000–200 hPa) anomalies (g kg−1), and the number of days with low-pressure systems over central India and e frequency of extreme rain events (number of grid cells exceeding 150 mm day−1 per year) over central Indian subcontinent (75°–85° E, 19°–26° N, inset boxes in a, d). f Time series of the frequency of widespread extreme events (number of days when the extreme events simultaneously cover ten grid cells or more). Stippling indicates trend values significant at 95% confidence level. The trend lines shown in the figures are significant at 95% confidence level. The smoothed curves on the time series analyses represent 10-year moving averages. The entire analysis is for the northern summer (June-September), for the years 1950–2015. The precipitation and cyclone data is based on IMD observations, and the specific humidity is based on NCEP reanalysis. See the “Methods” section for more information regarding the data "
* (Italics and Bold added)
Full article at : https://www.nature.com/articles/s41467-017-00744-9

You can peruse the raw data and see any "trend and acceleration" for yourself.
 
Last edited:
Off Topic ad-hominems...not open for any true discussion...baiting/trolling...
I refuse to participate in any argument, especially with anyone who chooses to utilize Logical Fallacies.


However, if you are truly interested in the issue and really care to discuss "the trend and acceleration", you can "look" at the research that was referenced for the wikipedia.org article that Quantum Quack quoted in his Post #104 at this Link : https://www.nature.com/articles/s41467-017-00744-9

" A threefold rise in widespread extreme rain events over central India
Abstract (partial)
Socioeconomic challenges continue to mount for half a billion residents of central India because of a decline in the total rainfall and a concurrent rise in the magnitude and frequency of extreme rainfall events. Alongside a weakening monsoon circulation, the locally available moisture and the frequency of moisture-laden depressions from the Bay of Bengal have also declined. Here we show that despite these negative trends, there is a threefold increase in widespread extreme rain events over central India during 1950–2015.*

Fig. 1

Trends in summer mean and extreme precipitation during 1950–2015. Observed trend in summer a mean precipitation anomalies (mm day−1 66 year−1) and b the frequency (66 year−1) of extreme precipitation events (precipitation ≥ 150 mm day−1). Mean precipitation for the season is 8.1 mm day−1. Time series of c of precipitation (mm day−1), d specific humidity (1000–200 hPa) anomalies (g kg−1), and the number of days with low-pressure systems over central India and e frequency of extreme rain events (number of grid cells exceeding 150 mm day−1 per year) over central Indian subcontinent (75°–85° E, 19°–26° N, inset boxes in a, d). f Time series of the frequency of widespread extreme events (number of days when the extreme events simultaneously cover ten grid cells or more). Stippling indicates trend values significant at 95% confidence level. The trend lines shown in the figures are significant at 95% confidence level. The smoothed curves on the time series analyses represent 10-year moving averages. The entire analysis is for the northern summer (June-September), for the years 1950–2015. The precipitation and cyclone data is based on IMD observations, and the specific humidity is based on NCEP reanalysis. See the “Methods” section for more information regarding the data "
* (Italics and Bold added)
Full article at : https://www.nature.com/articles/s41467-017-00744-9

You can peruse the raw data and see any "trend and acceleration" for yourself.
correct me If I am mistaken but the graph on the bottom right clearly indicates an uptick in "extreme" rain event frequency from about 2006

Notes:
Extreme rain events are considered as such when precipitation is greater than or equal to 150mm per day.
Typical average norm would be 8.1 mm day.
So to qualify for the label "Extreme" rain fall. The rain would have to be massively greater than the current norm. (>142mm more)
Also, for the next year the normal mean will be higher thus reducing the extremity of subsequent events.
 
correct me If I am mistaken but the graph on the bottom right clearly indicates an uptick in "extreme" rain event frequency from about 2006
Yes, indeed there does seem to be downtick(trough?) around 2003-2005 - followed by an uptick(peak?) around 2006 - which is then followed by another downtick by 2010 - then a smaller uptick and smaller downtick through 2013/2014?
I can only direct you to :
https://www.nature.com/articles/s41467-017-00744-9 said:
The smoothed curves on the time series analyses represent 10-year moving averages.
I refuse to pretend that I completely understand exactly why the researchers chose to present the data using that type of graph.
 
Last edited:
Yes, indeed there does seem to be downtick(trough?) around 2003-2005 - followed by an uptick(peak?) around 2006 - which is then followed by another downtick by 2010 - then a smaller uptick and smaller downtick through 2013/2014?
I can only direct you to :

I refuse to pretend that I completely understand exactly why the researchers chose to present the data using that type of graph.
An interesting thing about graph F is that it indicates a significant increase in the dynamic range ( deviation ) from the mean. Years 2006'ish to 2015
Needless to say though one could predict that in the following 10 years to year 2025 there could be one hell of a wet ride for that region if the trending mean remains steady...and worse if it accelerates.
 
Last edited:
Well...sorry but I am not discussing alarmism, unless you wish to discuss how alarming it is for people such as yourself to ignore the weather stats in front of them...
Whatever you discuss, if you present information which is also used by alarmists to increase hysteria, I will add some counterinformation which shows that there is no base for hysteria.
A three fold increase in extreme rain events over 14 years is a 300% increase on what was already a serious issue for India.
Do you deny this stat?
No. I have not checked the correctness, because I know that a 300% increase out of nothing is nothing, but that alarmists like such numbers very much. A 300% increase of rains in the Sahara will be not worth to be mentioned at all. India has some desert regions too. If it is a serious issue for India or not is not clear at all, one would have to invest time to check if it is. Maybe, maybe not. But it is obviously far from catastrophic, and this is what I have found simply by considering well-known information about famines and population growth.
What stat do you think will be available in another 6 years do you think? (total 20 years)
I have no base for any guess. Your 300% number gives me nothing at all. Why? I will illustrate this using an artificial example. Al-Kufrah in Libya has an average annual rainfall of 0.0338 inches (https://sciencing.com/average-yearly-rainfall-sahara-desert-5097814.html ). Climate change could increase this to, say, 10 inches. The resulting climate would be nonetheless arid. Despite an increase of 30000%, those who would start to try agriculture, if they would start at all, would prefer much more rain. What would be the expectation for the future after this? One could think about the extremal scenario, that it becomes extremely wet. Say, 300 inches. This would be a further 3000% increase, miserable 1/10th of the first 30000% increase. And it would be nonetheless completely implausible to expect this, it would make that quite arid region one of the wettest of the world.

Then, a "three-fold rise in widespread extreme rainfall events" is even more arbitrary and open to alarmistic misuse than the average rainfall over a year in the example above, because it depends on a quite arbitrary limiting line between a simply heavy rainfall, which would be not even named "event", and a "heavy rainfall event". What would be named in a reasonable society a "widespread heavy rainfall event"? Something which happens seldom. Say, once a year, not much more. So what would be a three-fold rise of them? Three times a year, not much more.

I see that iceaura gives us a nice chance to evaluate the natural evolution of this:
... if really curious, and wanting to make a stronger argument, they could look up the trend and acceleration. How much of that 300% happened in the last 20 years of the 65? If more than a third, evidence of an emergency incoming. If less than a quarter, good news.
What we would have to expect in the example above? Say, we had in 1901 1 event per year, after one half of the period, 1958, 3 events per year. Say, all continues as before. What would we expect 2015? 3*3=9 events would be one plausible guess. Then, iceaura would find 2 more such events during 1901-1958, but 6 more such events from 1958-2015. And would cry EMERGENCY!!!!11!1!

Summary: This is a type of statistics which is fine if you want to find out the sign - are there more heavy rain events today or less? For everything beyond this, it is worthless. The percentage of the increase is worthless, the changes in this already worthless number even more. And, by the way, the thing which makes floods in India worth a Wiki article is another one, mentioned by Wiki at the very beginning:
Often during times of heavy rainfall, drainage systems in residential areas are not adequate, or unchecked civil development severely impedes the functionality of an otherwise acceptable drainage system. Floods cause extremely large numbers of fatalities in every country, but due to India's extremely high population density and often under development standards, a large amount of damages and many deaths occurred.
In other words, with adequate drainage systems, this would be not a problem. And building such systems would easily allow to live the Indian people in security, and even if those heavy rainfall events become the everyday rainfall events during the rainy season. Which could be, if one starts with one such event in 1901, easily become 50 if there will be more rain in the average (say, all 2 days during the rainy season or so).
 
Off Topic ad-hominems...not open for any true discussion...baiting/trolling...
Like the rest of your tribe, you can't use "ad hominem argument" correctly in a sentence. The inability to use that term correctly, coupled with an insistence on using it frequently, is a field mark of the American wingnut.

Also like the rest of your tribe, you are incapable of "discussion" relevant to this thread topic, so whether or not you recognize the various opportunities for discussion I and others have provided you in this thread is of no importance - but a survey of your posting here does suggest that you might want to take concepts like "trolling" and "baiting" off the table.
Yes, indeed there does seem to be downtick(trough?) around 2003-2005 - followed by an uptick(peak?) around 2006 - which is then followed by another downtick by 2010 - then a smaller uptick and smaller downtick through 2013/2014?
The planet's climate and weather patterns do tend to behave like that, yep. Some of those patterns are regular enough to have names - various "oscillations" and "niños" and the like. Did you have some point you wanted to make?
I refuse to pretend that I completely understand exactly why the researchers chose to present the data using that type of graph.
And you refuse to learn why. But you are going to post about it.

And that explicit refusal to learn basic stuff about your supposed topic of discussion is characteristic of your tribe.It's why you guys can't discuss these topics per se, but instead must focus on other people's supposed flaws of character or political agenda - where your toolkit of illiteracies and ignorant presumptions can find employment, and your natural tendency to attempt bullying and slander need not be curbed.
You can peruse the raw data and see any "trend and acceleration" for yourself.
Already did (not the raw data of course - the linked graphs and text and such. I'm assuming that's what you meant.)
Did you notice anything you would like to share, as your contribution to a discussion on topic, in this thread? QQ already posted that link, iirc.
 
Whatever you discuss, if you present information which is also used by alarmists to increase hysteria, I will add some counterinformation which shows that there is no base for hysteria.

No. I have not checked the correctness, because I know that a 300% increase out of nothing is nothing, but that alarmists like such numbers very much. A 300% increase of rains in the Sahara will be not worth to be mentioned at all. India has some desert regions too. If it is a serious issue for India or not is not clear at all, one would have to invest time to check if it is. Maybe, maybe not. But it is obviously far from catastrophic, and this is what I have found simply by considering well-known information about famines and population growth.

I have no base for any guess. Your 300% number gives me nothing at all. Why? I will illustrate this using an artificial example. Al-Kufrah in Libya has an average annual rainfall of 0.0338 inches (https://sciencing.com/average-yearly-rainfall-sahara-desert-5097814.html ). Climate change could increase this to, say, 10 inches. The resulting climate would be nonetheless arid. Despite an increase of 30000%, those who would start to try agriculture, if they would start at all, would prefer much more rain. What would be the expectation for the future after this? One could think about the extremal scenario, that it becomes extremely wet. Say, 300 inches. This would be a further 3000% increase, miserable 1/10th of the first 30000% increase. And it would be nonetheless completely implausible to expect this, it would make that quite arid region one of the wettest of the world.

Then, a "three-fold rise in widespread extreme rainfall events" is even more arbitrary and open to alarmistic misuse than the average rainfall over a year in the example above, because it depends on a quite arbitrary limiting line between a simply heavy rainfall, which would be not even named "event", and a "heavy rainfall event". What would be named in a reasonable society a "widespread heavy rainfall event"? Something which happens seldom. Say, once a year, not much more. So what would be a three-fold rise of them? Three times a year, not much more.

I see that iceaura gives us a nice chance to evaluate the natural evolution of this:

What we would have to expect in the example above? Say, we had in 1901 1 event per year, after one half of the period, 1958, 3 events per year. Say, all continues as before. What would we expect 2015? 3*3=9 events would be one plausible guess. Then, iceaura would find 2 more such events during 1901-1958, but 6 more such events from 1958-2015. And would cry EMERGENCY!!!!11!1!

Summary: This is a type of statistics which is fine if you want to find out the sign - are there more heavy rain events today or less? For everything beyond this, it is worthless. The percentage of the increase is worthless, the changes in this already worthless number even more. And, by the way, the thing which makes floods in India worth a Wiki article is another one, mentioned by Wiki at the very beginning:

In other words, with adequate drainage systems, this would be not a problem. And building such systems would easily allow to live the Indian people in security, and even if those heavy rainfall events become the everyday rainfall events during the rainy season. Which could be, if one starts with one such event in 1901, easily become 50 if there will be more rain in the average (say, all 2 days during the rainy season or so).
you have got me curious!

here is the graph DumbestMOE and I were discussing:
I make no assumption as to the veracity of the data used ok? (even though the article states clearly that they have a high confidence at a 95% certainty regarding the trend lines.)
extremeeventsgraph_F.png
Article provided Information:
  • An extreme event is when rainfall for a given day is equal to or in excess of 150mm ( >0r= 150mm per 24hours )
  • The average daily rainfall is stated as being about 8.1mm per 24 hour day ( seasonal )
  • An extreme event can not be considered as extreme unless it is 150mm or greater, per 24 hours.
  • Events that are less than 150 mm are not included in the stats.
  • The smoothing line in the graph is the calculated average of EXTREME events. (not ordinary events)
Summary:
The graph states quite clearly that in 1950 the average frequency of Extreme events was 2 and that in 2015 the average frequency of EXTREME events 6.
so we have a change of a smoothed average of 2 extreme events ( in 1950) up to 6 events (in 2015) and that means that the frequency of smoothed average extreme events has increased 3 fold. (300%) 1950 - 2015

Do you agree?
Do you appreciate that we are talking about events that deliver in excess of or equal to 150mm of rain in a day?

Imagine 6 extreme rain events a year in the same region and what that actually means to the agriculture on the ground. And that was only up to 2015, we are now 2019
 
Last edited:
. A 300% increase of rains in the Sahara will be not worth to be mentioned at all.
You post the stupidest things with the most confidence of anyone on this forum.
In other words, with adequate drainage systems, this would be not a problem.
Except the damage it would still do to the agriculture, utilities, transportation systems, and so forth.
And very few places have drainage systems capable of handling what AGW is predicted to deliver - certainly Florida does not, or other areas along the Gulf Coast and Tennessee River valley, or some of the more important agricultural regions in California. And the Philippines are basically a tragedy waiting to happen, along with the Yangtze River valley.

Thing is, AGW is predicted to relocate these storms, as well as intensify them - so the areas that will get hit are not the areas best prepared already.
Then, a "three-fold rise in widespread extreme rainfall events" is even more arbitrary and open to alarmistic misuse than the average rainfall over a year in the example above, because it depends on a quite arbitrary limiting line between a simply heavy rainfall, which would be not even named "event", and a "heavy rainfall event". What would be named in a reasonable society a "widespread heavy rainfall event"?
That distinction (between ordinary heavy rainfall and damaging torrential events) was the exact topic discussed in the early journal articles that first reported on this feature of AGW's influence on rainfall distribution. The researchers pointed out that the issue was unexpected and overlooked, so there was no consensus in how it should be reported or described in the research and analysis, and that tended to muddy the analysis. It's a long discussion - but iirc they did settle on a set of criteria for reporting research findings, so everybody would know what had been discovered and how to analyze it.

Scientists, doing science. Knowing what they are talking about. It's a pleasure to read their reports and analyses.

You should read up on the research. You might post with more of a clue.
 
Back
Top