The normal 11-year solar cycle cannot account for the global heating we are observing. Climate scientists are well aware of that effect.Perhaps, the grand solar maximum of the latter 1/2 of the last century(also known as the modern maximum) was a contributing factor.

You are using an out of date browser. It may not display this or other websites correctly.
You should upgrade or use an alternative browser.
You should upgrade or use an alternative browser.
catastrophization
- Thread starter sculptor
- Start date
RainbowSingularity
Valued Senior Member
sculptor
Valued Senior Member
normal is a constructThe normal 11-year solar cycle cannot account for the global heating we are observing. Climate scientists are well aware of that effect.
which of the following is "normal"? Is 14 normal? Is 19 normal? Is it normal to have more sunspots in the sun's northern or southern hemisphere?
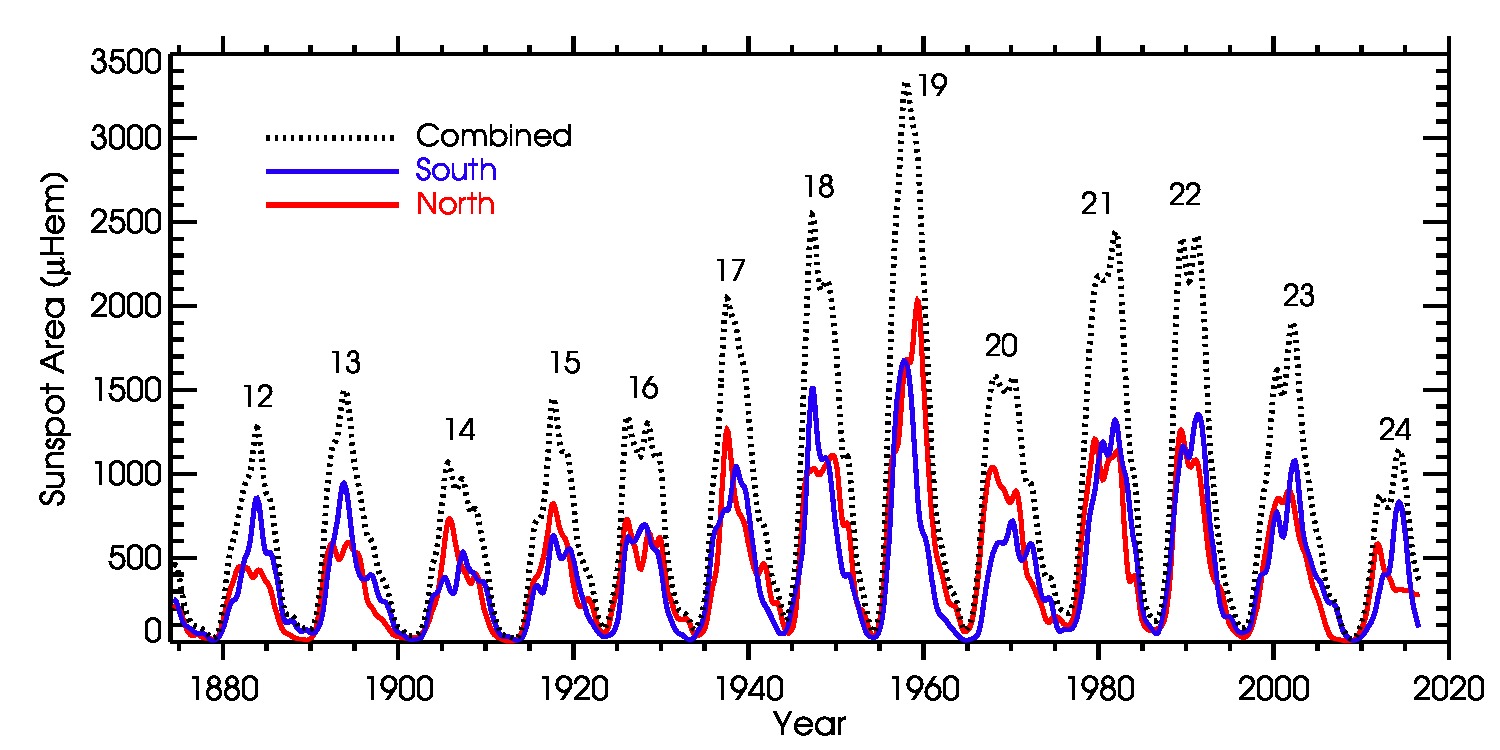
look beyond your 11 year window
and
You will see that the sun is a variable dynamo...
This "there's no such thing as normal, so anything that happens is probably normal" argument is your worst to date.normal is a construct . . .
sculptor
Valued Senior Member
Those are your words---NOT MINE....That is your argument---not mine.This "there's no such thing as normal, so anything that happens is probably normal" argument is your worst to date.
If you create a fiction in your imagination, that is your fiction, not mine-----should you choose to argue with that fiction, then you are invariably arguing with yourself.
There is a discernible range of possibilities for this earth and it's climate.
From ice at the mid latitudes(or slushball earth) to balmy conditions at the poles.
Currently, we are in an interglacial within an ice age(the quaternary).
In the last interglacial, it seems that Greenland was largely ice free and forested, and, at the end, the west antarctic ice sheet seems to have collapsed, with sea levels 6-8 meters above current.
If you would look to the future, learn the past.
RainbowSingularity
Valued Senior Member
This "there's no such thing as normal, so anything that happens is probably normal" argument is your worst to date.
Is it normal to have more sunspots in the sun's northern or southern hemisphere?
where is the data showing days without sun spots ?
which year in modern history had the most days without sun spots ?
2008 sub prime mortgage fraud global credit fraud global market collapse ... !
thats when !
im not dismissing solar science
but counting sun spots and making a graph to mock Co2 graphing seems like a deliberate trolling of scientists while pretending to be a pro-science person.
all under the guise of "catastrophisation"
im sure porn on the world wide web makes a lot of big data, but people dont seem to quote it for trends and inferences of "reality " why is that ?
sculptor
Valued Senior Member
where is the data showing days without sun spots ?
im not dismissing solar science
but counting sun spots and making a graph to mock Co2 graphing seems like a deliberate trolling of scientists while pretending to be a pro-science person.
all under the guise of "catastrophisation"
Contributing factors
not mocking anything----except seeking simple answers to complex questions.
From 1600 to 1715 AD, very few sunspots were seen, and from 1645 to 1715, many years had no sunspots at all, despite the fact that many scientists with telescopes were actively looking for them. The longest known minimum (about 50 years) of virtually no sunspots occurred during the Maunder Minimum.
https://www.sciencedirect.com/topics/earth-and-planetary-sciences/maunder-minimum
and the debate concerning whether or not we are headed into another grand minimum rages
I do not know
It was not just the maunder minimum

the wolf, sporer, and maunder all contributed to the lowering of earth's energy balance, culminating in the year without a summer and mass starvation, disease, and death.
RainbowSingularity
Valued Senior Member
https://en.wikipedia.org/wiki/Maunder_MinimumThe Maunder Minimum roughly coincided with the middle part of the Little Ice Age, during which Europe and North America experienced colder than average temperatures. Whether there is a causal relationship, however, is still under evaluation.[13] Research at the Technical University of Denmark and the Hebrew University of Jerusalem has linked large solar eruptions to changes in the Earth's cloud cover and clouds are known to affect global temperatures.[14] The current best hypothesis for the cause of the Little Ice Age is that it was the result of volcanic action.[15][16] The onset of the Little Ice Age also occurred well before the beginning of the Maunder minimum,[15] and northern-hemisphere temperatures during the Maunder minimum were not significantly different from the previous 80 years,[17] suggesting a decline in solar activity was not the main causal driver of the Little Ice Age.
well before cell phones cameras and news wires where an entire island could be blown up or disappear and an entire society of people wiped out and no one would know.
look at the island of Atlantis
the https://en.wikipedia.org/wiki/Antikythera_mechanism
where did that civilization disappear to ?
gone...
not a trace
OK. So this change is NOT normal.Those are your words---NOT MINE....That is your argument---not mine.
Welcome to the catastrophists!
That graph conveniently stops at about 1950. What does it look like when you add the data from 1950 to the present?
Any debate "rages"mostly around its role as a possible contributor to the effects of AGW - a far more significant and immediately serious matter.and the debate concerning whether or not we are headed into another grand minimum rages
Already looked at, already "learned", by everyone involved in climate research and everyone trying to predict the effects of AGW.In the last interglacial, it seems that Greenland was largely ice free and forested, and, at the end, the west antarctic ice sheet seems to have collapsed, with sea levels 6-8 meters above current.
If you would look to the future, learn the past.
You keep posting the same basic bs. It gets the same basic response: nothing that happened in the past changes what's happening now.
According to the research, AGW is happening now. According to the research, any natural cycles that are also happening are by comparison minor contributors to that major event.
sculptor
Valued Senior Member
That graph conveniently stops at about 1950. What does it look like when you add the data from 1950 to the present?
That was a carbon 14 chart. which basically became a worthless proxy when atomic bomb testing skewed the results.
I don't see anything convenient there...
RainbowSingularity
Valued Senior Member
skewing the rage away from atmospherics of hysterical subjectivity ...
how wide spread were humans lighting massive Forrest fire some 500 years ago ?
my Brazilian is burning ...
https://rainforests.mongabay.com/08indo_fires.htm
thankgoodness there is no climate there so there is nothing to change
how wide spread were humans lighting massive Forrest fire some 500 years ago ?
my Brazilian is burning ...
https://rainforests.mongabay.com/08indo_fires.htm
The Asian Forest Fires of 1997-1998
From October through November 1997, fires in Indonesia and the resulting haze made front-page news around the world as the haze spread as far the Philippines to the north, Sri Lanka to the west, and northern Australia to the south. As the Southeast Asian "tiger" economies collapsed, fires burned thousands of squares miles of rainforest, plantations, conversion forest, and scrubland in Kalimantan, Sumatra, Sulawesi, Irian Jaya, Papua New Guinea, Bali, Lombock, and Sarawak, Malaysia. Though official government estimates peg the area affected at 1.85 million acres (750,000 ha), environmental organizations like the national environmental group WAHLI (the Indonesian Forum for Environment) say at least 4.2 million acres (1,714,000 ha) went up in smoke By mid-1998 the estimate had climbed beyond 5 million ha (12.4 million acres). Estimates for the area burned in East Kalimantan alone in 1998 range from 445,000 acres (180,280 ha) to 700,000 acres (284,000 ha). Regardless of the extent of area burned, the fires caused serious regional health problems and economic loss, and created an ecological nightmare.
... so much for the age of big dataThat graph conveniently stops at about 1950. What does it look like when you add the data from 1950 to the present?
thankgoodness there is no climate there so there is nothing to change
Last edited:
Not forest fires, as far as anyone has discovered.how wide spread were humans lighting massive Forrest fire some 500 years ago ?
But setting major savannah, prairie, and brushland fires is a human innovation older than agriculture - for thousands of years a large fraction of Australia, and several expanses in North America, appear to have been maintained as open land for hunting large herbivores by regular, purposeful, and persistent fire setting. Entire ecosystems of those regions in Australia seem to have evolved in adaptation - new species, fire adapted subspecies, enough time under that human regime to have undergone Darwinian evolution.
sculptor
Valued Senior Member
just for fun?
https://coast.noaa.gov/digitalcoast/tools/slr.html
https://coast.noaa.gov/digitalcoast/tools/slr.html