The Etp Model Has Been Empirically Confirmed

Status
Not open for further replies.
For example, what you just said is gibberish because EROEI does not have units of money, it has units of energy.
You are correct, I misspoke (miswrote?). Thanks for being a stickler for details. I made the correction in my post.

Actually, despite the fact that I haven't been provided the details of the model and therefore can't be expected to understand it very well, I'm reasonably certain I understand it better than you.
I am reasonably sure that is a lie, Russ. But I am not calling you a liar.

By what mechanism, specifically, did that happen? IE, a barrel of oil, sitting in the ground and recoverable at 60abarrelsuddenlybecameuneconomicaltorecoverat 60 a barrel suddenly became uneconomical to recover at 50 a barrel? Exactly how?
It isn't that mysterious, Russ.

Futilitist%20End%20of%20the%20Oil%20Age%20Small_zpsaske3rd0.jpg


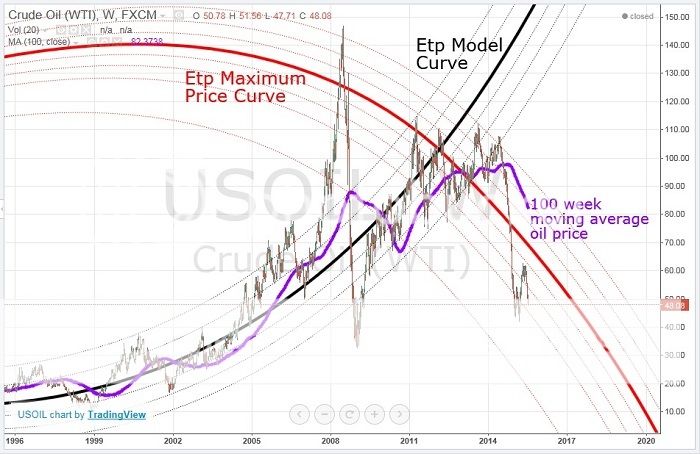
As the graph above clearly shows, the Etp Model Curve intersected the Etp Maximum Price Curve around March of 2012. Although the oil price immediately plunged quite rapidly, the Fed unleashed Operation Twist and QE3. This helped the price recover and it broke through the Etp Maximum Price Curve and managed to continue to rise for a while. At the time of the start of the price collapse in June of 2014, the oil price (WTIC) was around 107 dollars a barrel, but the Etp Maximum price had already fallen well below the actual price. That meant that the economic benefit (GDP/barrel) of a barrel of oil had fallen to the point that the energy in a barrel of oil could no longer support such a high price. So, the price naturally collapsed. Simple.

Interestingly, the oil price bounced hard off of the Etp Maximum Price Curve on the way down. The bounce happens at the exact mid point of a sinusoidal wave. Another amazing Etp model coincidence!

The oil price could theoretically be somewhat higher than it is currently. But the reason the oil price does not rise to reach the Etp Maximum Price curve is because of economic damage positively feeding back through the system. We are in the early stages of a multiphasic collapse. This process will continue. What could possibly stop it?

And remember Russ, the Etp maximum Price Curve represents just that: a maximum oil price. The minimum price is zero.

Seven pages of this thread is eight more than I can be bothered to read.
I am sorry to hear (read) that. You really should give it a try, though. The topic is more complex than sound bites can communicate.

But concerning fossil fuels... they're not a renewable resource, so what's going to happen when they all run out?
The problem is not about running out of oil. That is just a red herring. We are likely to drown in the stuff. But, due to the entropy in the oil production system, the energy returned on energy invested for oil production has declined to the point that oil cannot supply enough economic benefit to society to pay for it's continued production. This is a big deal because by 2021, oil will reach the "zero state" as an energy source, meaning zero GDP/barrel. Meaning a loss of 38% of our total energy and about 90% of our transportation energy. It is hard to imagine that civilization could survive that.

Once again, with so much potentially at stake, you should perhaps take some time read the thread and understand the Etp model. Or not. Your choice.


---Futilitist:cool:
 
Last edited:
You are correct, I misspoke (miswrote?). Thanks for being a stickler for details. I made the correction in my post.
A shocking admission, but your contrition is noted. 2 cool points returned to you. So let's look at what you changed it to:
The oil price fell when the economic value of a barrel of oil had fallen well below the actual price...
What is the economic value of a barrel of oil today and what was it a year ago? How can I calculate it? Considering that I didn't buy a new car in the past year and my house will require roughly the same amount of heating this winter as last winter, how can the value that I receive from a barrel of oil have changed?
It isn't that mysterious, Russ.
Since you are hiding it, that most certainly makes it mysterious: how do I know that the "ETP Maximum Price Curve" wasn't just traced over a spaghetti noodle that accidentally fell onto your iPad when you were eating while surfing if you won't provide the formula for generating the curve?
As the graph above clearly shows, the Etp Model Curve intersected the Etp Maximum Price Curve around March of 2012. Although the oil price immediately plunged quite rapidly...
What, specifically, caused the drop? Don't just say that two lines crossed on the graph -- they have to represent something out in the real world. I know, for example, that my car didn't suddenly get much more efficient in 2012, so how could the value of oil have dropped for me?
But the reason the oil price does not rise to reach the Etp Maximum Price curve is because of economic damage positively feeding back through the system.
What economic damage? And don't say last week's stock market drop because the week before that oil prices were at about the same level -- so there must have been significant economic damage evident at that time, that pushed oil prices down....which, by the way, goes back to the logic you used previously that I referenced in my previous post. It's the logic your original thread 2+ years ago: high prices cause economic collapse, then economic collapse causes a drop in demand. Then a drop in demand causes prices to drop.
 
What is the economic value of a barrel of oil today and what was it a year ago? How can I calculate it? Considering that I didn't buy a new car in the past year and my house will require roughly the same amount of heating this winter as last winter, how can the value that I receive from a barrel of oil have changed?
This has all been well covered before. And you know it.

Since you are hiding it, that most certainly makes it mysterious: how do I know that the "ETP Maximum Price Curve" wasn't just traced over a spaghetti noodle that accidentally fell onto your iPad when you were eating while surfing if you won't provide the formula for generating the curve?
I am not hiding anything. I think you really know that.

And I don't have an iPad. Since your crack pot theory about hidden mysteries relies so heavily on a non-existent iPad to drop imaginary spaghetti on, you must be wrong.

What economic damage? And don't say last week's stock market drop because the week before that oil prices were at about the same level -- so there must have been significant economic damage evident at that time, that pushed oil prices down....which, by the way, goes back to the logic you used previously that I referenced in my previous post. It's the logic your original thread 2+ years ago: high prices cause economic collapse, then economic collapse causes a drop in demand. Then a drop in demand causes prices to drop.
There has been an incredible amount of economic damage ongoing since the great recession. You have just never been willing to admit that.

What, specifically, caused the drop? Don't just say that two lines crossed on the graph -- they have to represent something out in the real world. I know, for example, that my car didn't suddenly get much more efficient in 2012, so how could the value of oil have dropped for me?
I explained it all pretty well, Russ. Read it again. You don't really understand the Etp model, as you just claimed. If you really did understand it, you wouldn't be asking this question yet again. Making false claims is lying.

On the other hand, you might actually understand the Etp model and it's consequences well enough that you can't really come up with a rational argument against it. So, instead, perhaps you are choosing to be intentionally vexatious. That is trolling (as well as lying).

So which is it, Muddy Watters? Are you actually unable to grasp the Etp model, or are you lying and trolling? Tell the truth for once. ;)

Seriously though, I find you to be the most pompous, humorless, posturing, game playing, uptight and downright annoying posters ever. It is well within my rights not to answer any of your questions. Quit trying to waste my (and everyone else's) time. This is supposed to be a science forum.

Oh, and thanks for the 2 cool points, by the way. I appreciate that. :)


---Futilitist:cool:
 
Last edited:
Hey Russ.

Here is some more information to help you understand the Etp model:

"According to the Etp Model 2012 was when world petroleum production passed through the energy half way point; the point where it required 1/2 of the energy in a unit of petroleum to extract, process, and distribute it. Using an energy metric that means that the general economy is receiving less energy that what was required to have it delivered. If it requires at least 1 BTU to acquire 1 BTU, the economy can no longer acquire all the oil produced.

Using a dollar metric, the demand for petroleum is dependent upon the amount of economic activity occurring. A stronger economy uses more oil than a weak one. The amount of economic activity resulting from the use of petroleum is dependent on how much activity a unit of petroleum can power. Oil that could power zero activity would produce zero demand. That is, a dollar's worth of petroleum must be able to power a dollar's worth of economic activity to allow that economy to buy the oil. We have reached the point where a dollar's worth of oil no longer powers a dollar's worth of economic activity. Thus there will always be from this point forward more oil than demand for it. Because, of the lower price, producers must maximize production to maximize revenue. It is better to lose 1 dollar than 2 dollars. Consequently, inventories will continue to rise."

~BW Hill

BW Hill, the Etp model's creator, regularly answers questions about the Etp model at:

http://peakoil.com/forums/the-etp-model-q-a-t70563.html

If you are really interested in understanding the Etp model, why not go to peakoil.com and ask your questions directly to BW Hill? I am sure he will be glad to answer any real questions you might have and help you clear up your misunderstandings. After that, come back, we'll talk. Put up or shut up, Mr. Science.


---Futilitist:cool:
 
Last edited:
Would not more people be convinced the ETP model has something to say if some formulas were included?

For instance, how does the model explain the oil crisis in the 70s, and the subsequent "correction"? I note one of your links has a graph which excludes the oil crisis, strongly suggesting the ETP oil price curve is an interpolation.
 
Last edited:
And the natural evolution of the Chinese economy is thermodynamic. Duh.


How would any halfway decent newspaper article announce the end of the world? What would the headline say?


---Futilitist:cool:

I would be fascinated to see by what argument the current property bubble in China could be attributed to thermodynamics.:D

As for the newspaper headline, how about, "The End of the World is Nigh!"?
 
Hey Russ.

Here is some more information to help you understand the Etp model:

"According to the Etp Model 2012 was when world petroleum production passed through the energy half way point; the point where it required 1/2 of the energy in a unit of petroleum to extract, process, and distribute it. Using an energy metric that means that the general economy is receiving less energy that what was required to have it delivered. If it requires at least 1 BTU to acquire 1 BTU, the economy can no longer acquire all the oil produced.

Using a dollar metric, the demand for petroleum is dependent upon the amount of economic activity occurring. A stronger economy uses more oil than a weak one. The amount of economic activity resulting from the use of petroleum is dependent on how much activity a unit of petroleum can power. Oil that could power zero activity would produce zero demand. That is, a dollar's worth of petroleum must be able to power a dollar's worth of economic activity to allow that economy to buy the oil. We have reached the point where a dollar's worth of oil no longer powers a dollar's worth of economic activity. Thus there will always be from this point forward more oil than demand for it. Because, of the lower price, producers must maximize production to maximize revenue. It is better to lose 1 dollar than 2 dollars. Consequently, inventories will continue to rise."

~BW Hill

BW Hill, the Etp model's creator, regularly answers questions about the Etp model at:

http://peakoil.com/forums/the-etp-model-q-a-t70563.html

If you are really interested in understanding the Etp model, why not go to peakoil.com and ask your questions directly to BW Hill? I am sure he will be glad to answer any real questions you might have and help you clear up your misunderstandings. After that, come back, we'll talk. Put up or shut up, Mr. Science.


---Futilitist:cool:

Since your all arguments, graphs and references have been so unpersuasive up to this point, there is no reason for anyone, scientist or otherwise, to waste time on reading more about something that has all the signs of being just another crank notion. One might as well devote one's time to reading more about the ideas of Erich von Daniken or L Ron Hubbard. There is plenty of balls out there on the internet and there are plenty of nutters on the street corners. It is not closed-minded on the part of scientists to ignore both.
 
Last edited:
Ok, I'm going with my own theory, which is that the cost of building new wells has been the main driver of the price of oil since the 60's.

The maximum price curves in the ETP model are based on what the energy in a barrel of oil can produce in an economy, before and after it's been delivered to consumers.

So a theory that the cost of production will reach a break even point seems sound enough, but you have to account for how much that new production adds to world reserves. If for some reason a barrel of oil can no longer produce enough to sustain the costs of delivering (and producing) the oil, I guess there's a problem.
 
You can't predict if some new technology might be invented in the future that could make fuel extraction much more economically efficient.

Or would that "violate the second law of thermodynamics" somehow?
 
Ok, I'm going with my own theory, which is that the cost of building new wells has been the main driver of the price of oil since the 60's.

The maximum price curves in the ETP model are based on what the energy in a barrel of oil can produce in an economy, before and after it's been delivered to consumers.

So a theory that the cost of production will reach a break even point seems sound enough, but you have to account for how much that new production adds to world reserves. If for some reason a barrel of oil can no longer produce enough to sustain the costs of delivering (and producing) the oil, I guess there's a problem.

Actually I don't think it will even reach a break-even point. What will eventually happen - when oil becomes scarce enough - is that it will be increasingly reserved for those applications, for example transport fuels, in which it has the biggest inherent advantages. This will raise the price it can command relative to other sources of energy, as by then the rest of the economy will be getting well through the process of weaning itself off oil, in favour of nuclear and renewables.

Futilist seems to live in a world in which, for some bizarre reason, oil explorers continue to develop wells at a loss. Clearly they don't and never will. But you could easily have an eventual situation in the future, in which, say, energy from cheaper renewables was used to extract a lesser quantity of energy from oil reserves. This would make perfect economic sense (i.e. it would make a profit) if this oil were being used for particular applications in the economy (such as transport fuel, petrochemicals, lubricants, etc) that commanded a premium over its simple calorific value. Oil has a value related to the economic value of what it, specifically, can do. Oil is not just calories, as far as an economy is concerned.

(P.S. I say this last with some feeling, as someone who worked for over thirty years in an oil major, mostly in the lubricants division.:biggrin: )
 
Last edited:
This has all been well covered before. And you know it.
No, it really hasn't - and you know it. I've asked repeatedly and you've repeatedly either just said "entropy" or flatly refused. Remember, early in the thread, you said: "I am sorry, I cannot provide it for you." You're willing to flood the thread to "answer" everything but that (such as all the content of the rest of the post). 2 cool points docked. You held on to them as long as you could!
[from the next post] Here is some more information to help you understand the Etp model:
None of that contains the information I requested. Futilitist, if someone made the same request of me for a claim I'd made, I'd post the actual Excel spreadsheet I used to make the calculations so they could see exactly how I generated it. Again: I need to know exactly how that curve was generated in order to be able to fully evaluate it.
I am not hiding anything. I think you really know that.
Great! So you no longer refuse to post the details of the model? Then post the details of the model.
There has been an incredible amount of economic damage ongoing since the great recession. You have just never been willing to admit that.
Specify the damage and I'll have no choice but to admit it.
I explained it all pretty well, Russ. Read it again.
This entire response to me was a non-responsive dodge. This is your thread, futilitist: if you refuse to discuss the topic of your own thread, what is the point of keeping it open? How do you expect to ever convince anyone you are right if you refuse to discuss the topic?
Seriously though, I find you to be the most pompous, humorless, posturing, game playing, uptight and downright annoying posters ever. It is well within my rights not to answer any of your questions.
And you were doing so well just a post earlier, even admitting to an error -- nothing in my post was deserving of such a vitriolic response. All were perfectly level-headed and reasonable questions. I'm guessing that backing you into a corner/so clearly focusing on your shortcomings set you off.
 
Last edited:
Great! So you no longer refuse to post the details of the model? Then post the details of the model.
I think it is clear he does not have the model. He wouldn't understand it if he did have it. I think it is pretty clear that he found the website with the pretty graphs and is using them to champion his end of civilization rant. Nothing more than any of the other end of the world nuts. He and they continually predict the end for a certain date or period and when it doesn't happen they move the end of the world date out.
 
I think it is clear he does not have the model. He wouldn't understand it if he did have it. I think it is pretty clear that he found the website with the pretty graphs and is using them to champion his end of civilization rant. Nothing more than any of the other end of the world nuts. He and they continually predict the end for a certain date or period and when it doesn't happen they move the end of the world date out.

Yes I think you are right. He's out of his depth - can't even grasp basic economics.
 
I think it is clear he does not have the model. He wouldn't understand it if he did have it. I think it is pretty clear that he found the website with the pretty graphs and is using them to champion his end of civilization rant. Nothing more than any of the other end of the world nuts. He and they continually predict the end for a certain date or period and when it doesn't happen they move the end of the world date out.
Yes, I think you are right, but the remaining disconnect is that he's claimed he was given the book for free. So either he has the equation and is refusing to provide it or it wasn't in the book. It really could be either, but yes, as you say the bottom line is that he would explain more if he understood it.
 
There has been an incredible amount of economic damage ongoing since the great recession. You have just never been willing to admit that.
actually since currency.. there has always been economic problems. as population grows, this problem increases, and as such duration increases the increase.
 
nothing in my post was deserving of such a vitriolic response. All were perfectly level-headed and reasonable questions. I'm guessing that backing you into a corner/so clearly focusing on your shortcomings set you off.
actually, you asked for the , possibly inaccurate, or non existence formula..
LIM. :)
 
Status
Not open for further replies.
Back
Top