You need to re read this thread, Billy T. This has all been very well covered before (and you know that).
http://www.thehillsgroup.org/depletion2_022.htm
The Energy Factor, Part IV
The Price of Oil
The price of petroleum is controlled by two factors:
1) The cost of production.
2) The $ amount that the end consumer (the
NEGs) can afford to pay for it.
What the end consumer pays must be sufficient to cover the cost of production. All production cost must be borne by the end consumer, who includes the end buyer, and the societal cost required to produce petroleum, and its products.
The
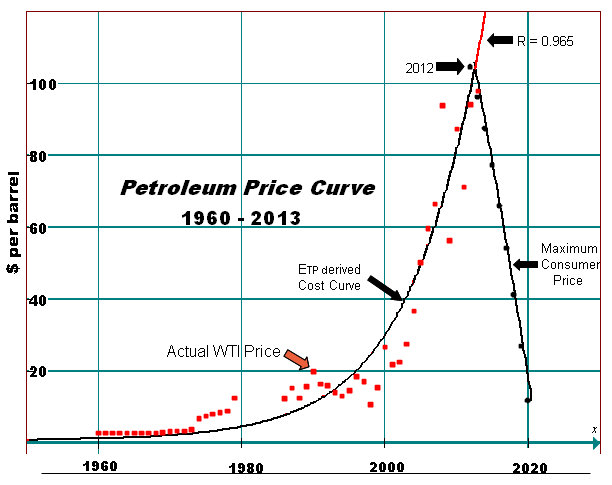
Petroleum Price Curve, shown below, reflects the two factors that have, and will continue to control petroleum prices. The
ETP derived Cost Curve is constructed from the
ETP model, and has mapped the price of petroleum since 1960 with a correlation coefficient of 0.965. It is the most accurate pricing model that has ever been developed.
The
Maximum Consumer Price curve was also developed from the
ETP model. It represents the maximum price that the end consumer can pay for petroleum. It is based on the observation that the price of a
unit of petroleum can not exceed the value of the economic activity that the energy it supplies to the end consumer can generate.
The energy content of a unit of petroleum is fixed by its molecular structure. The energy to produce a unit of petroleum, and its products increases with time as a result of the entropy production of the
PPS (
Petroleum
Production
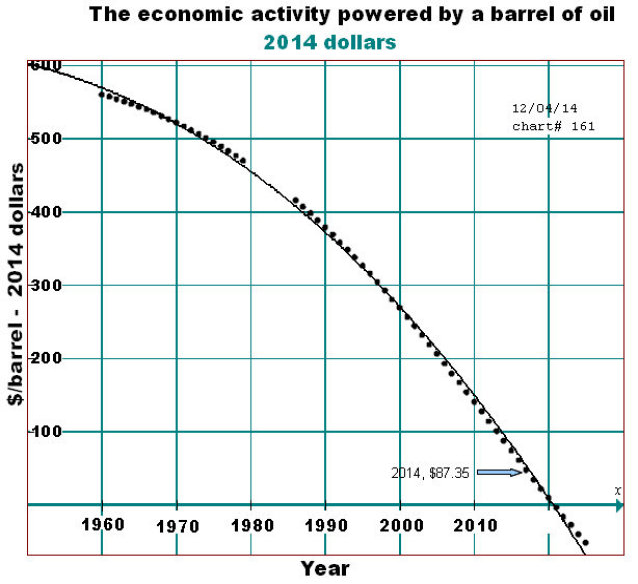
System). The energy remaining for use by the general economy declines, and the economic activity that the petroleum can power also declines.
Chart# 161 below shows the historical, and projected economic activity in 2014 dollars that a barrel of petroleum (37.5° API crude) has, and will be able to power.

A more complete explanation of how the
Maximum Consumer Price curve was formulated is show in
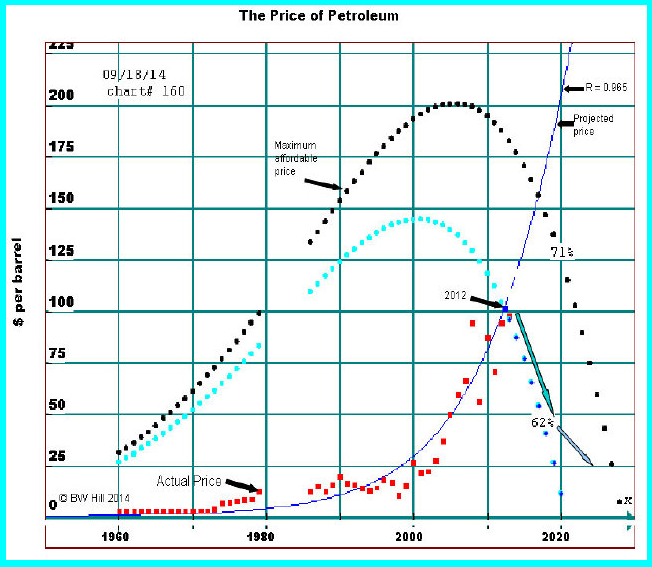
chart# 160 below:

The two
Maximum affordable price curves labeled 71% (black), and 62% (light blue) are skewed logistic curves. There is no explicit mathematical equation to describe them. They are derived numerically, and the dots represent values for specific years. The 71% curve is the maximum theoretical energy that can be extracted from a unit of 37.5° API crude. Its value is derived from the combustion equations of hydrocarbons. The 62% curve is the average energy extracted from the same hydrocarbon by the end user. It passes through the
ETP derived price curve at the inflection point of the
ETP curve in year 2012. 2012 was the energy half way point for petroleum production. It was the year when it required one half of the energy content of petroleum to produce the petroleum, and its products.
The individual points are generated from the equation:
$/barrel = (Energy delivered - ETP value/ BTU/$) * 42.
Energy delivered = 140,000 BTU/gal *0.62 (140,000 BTU/gal - the energy content of 37.5° API crude)
ETP value is derived from the
ETP function
BTU/dollars is taken from the BTU/dollars graph -
Graph# 12
The
Maximum Consumer Price curve is curtailed at 2020 at $11.76/ barrel. At this point petroleum will no longer be acting as a significant energy source for the economy. Its only function will be as an energy carrier for other sources. Production will continue as long as producers can realize the lifting costs at existing fields. E&D expenditures, and field maintenance costs will have been curtailed. All production from that point forward will be from legacy fields only. The economic impact that will result from the energy lost to the general economy is beyond the scope of this report.
The energy content of a unit of petroleum is fixed by its molecular structure. The energy to produce a unit of petroleum, and its products increases with time as a result of the entropy production of the
PPS (
Petroleum
Production
System). The energy remaining for use by the general economy declines, and the economic activity that the petroleum can power also declines.
Chart# 161 below shows the historical, and projected economic activity in 2014 dollars that a barrel of petroleum (37.5° API crude) has, and will be able to power.

Historically, petroleum has been a primary beneficiary to the economy. The economic activity that it powered was greater than the cost of the petroleum. Its historical effect can be seen in
Graph# 25 (
World GDP vs Cumulative Production). That benefit is now declining, and by the early 2020's an increased use of petroleum will no longer add to GDP. It will become more cost effective for society to begin limiting its use of petroleum as the use of petroleum transitions from a GDP enhancer to a GDP reducer.
~The Hills Group
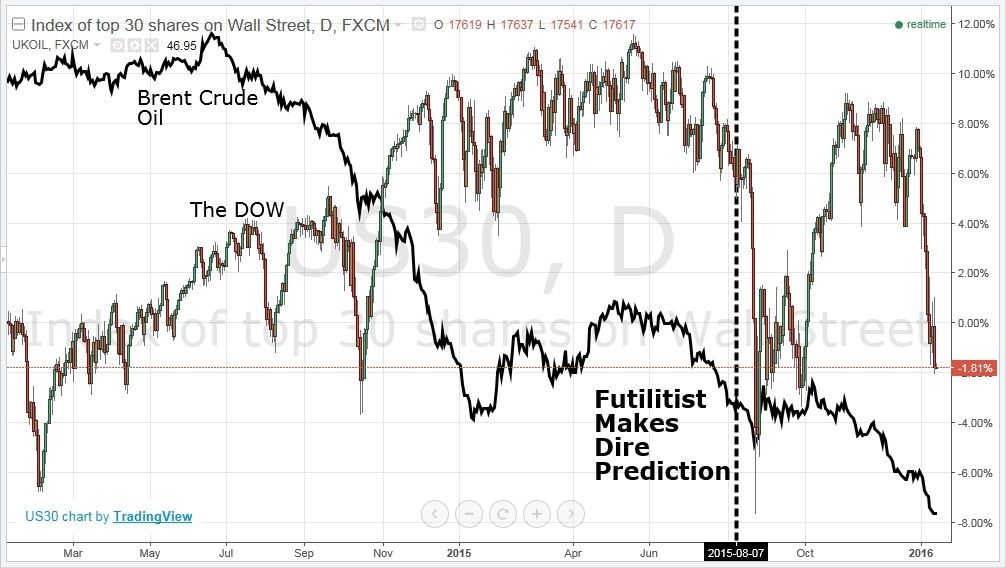
---Futilitist


