In my original post on this thread, I reprinted my empirical confirmation of the Etp model from peakoil.com. Here is how it was received there:
Re: The Etp Model, Q & A

by
shortonoil » Thu 06 Aug 2015, 18:39:26
Hi <i>Futilitist</i>
Beautifully done.
With your permission I would like to put up a page at the site displaying your graphs. Drop me an email.
BW Hill
http://www.thehillsgroup.org/
Re: The Etp Model, Q & A

by
Observerbrb » Thu 06 Aug 2015, 19:28:56
Hello Futilitist (I'm Kondratieff, I am sure you remember me).
I just would like to say that you did an amazing job.
Best Regards,
Re: The Etp Model, Q & A

by
shortonoil » Thu 06 Aug 2015, 19:47:13
...Futilitist in his post above also has a very possible explanation for the huge drop in price we are witnessing. When the system went through the energy half way point it became unstable. In such a case we could expect massive price swings around the Max Affordability curve. That explanation also has the benefit of establishing the actions of the financial system as an effect; not a cause, and physics would win again. Let's hope the rebound is soon enough to save the financial integrity of the petroleum system for a few more years?
Re: The Etp Model, Q & A

by
Whatever » Fri 07 Aug 2015, 12:29:59
Hi Observerbrb.
Thanks. Good to see you again.
Hi BW.
Thanks. After 10 years of trying to understand and explain the energy situation, this is the most positive response I have ever received. The Etp model is a major breakthrough in science. It is the key to understanding our world. I am honored that you want to use my graphs. I will be in touch via email.
Futilitist in his post above also has a very possible explanation for the huge drop in price we are witnessing. When the system went through the energy half way point it became unstable. In such a case we could expect massive price swings around the Max Affordability curve.
Unfortunately, I don't think we can expect too many massive price swings around the Max Affordability curve. The basic logic is that the Etp curve is a strange attractor and the Max Affordability curve is a strange repeller. As we get further from the original Etp curve, it tends to have less and less effect on the overall system, while the effect of the Max Affordability curve tends to increase as we approach it.
The oil price might rise rapidly in the case of a massive, sudden supply shortfall (frackers go bust, Saudi pipeline explosion, WWIII, etc.). This could theoretically push the price up over the Max Affordability curve, but not for very long, and the reversion to the mean will be vicious.
Basically, the whole system has less and less vigor over time, making large price increases less and less likely as time goes on.
We are essentially already in collapse.
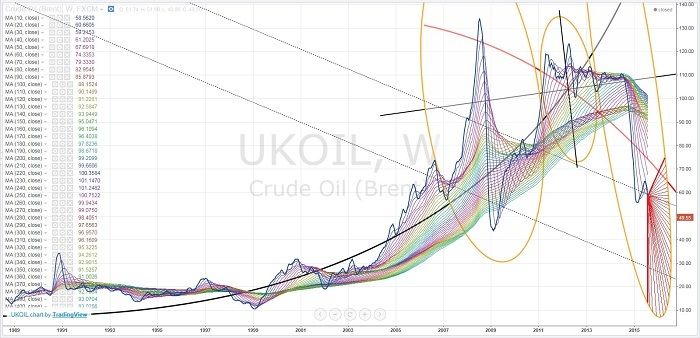
Here is a graph showing where I think the oil price is headed:
The red zone shows the area of the most likely near term price moves.
I think the economy is at a critical phase right now. I believe we are about to have a stock market crash. I would guess that the price of oil will soon (before 2016) drop to somewhere in the low 30s or possibly even lower.
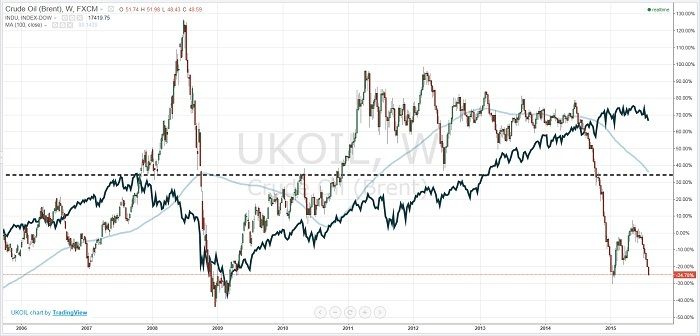
Here is a comparison between the oil price and the Dow Jones Industrial average:
The dotted line shows the highest price the Dow reached during the last oil spike and crash. The current level was only made possible through extraordinary central bank measures. Things are not looking good.
---Futilitist
----------------------------
My post above forecasts the onset of the stock market correction about 2 weeks in advance. This correction is not yet complete. World stock markets will continue falling. And the oil price is well on track to match this forecast. Treat the above as the official Futilitist forecast going forward, until I do my next official update.
---Futilitist


