Hi Everyone.
I have independently confirmed the validity of the Etp model.
http://peakoil.com/forums/the-etp-model-q-a-t70563-180.html#p1262220
"Thanks Pops.
I agree we should stay on topic.
Hi again BW. Thanks for the kind words. The level of knee-jerk hostility that I received when trying to honestly discuss the Etp model at peakoilbarrel helped convince me the Etp model must, in fact, be valid!
The physics of the model made instant sense to me. But when I first saw the Etp model, I was a little frustrated that I couldn't see the Etp curves over the more familiar daily or weekly oil charts I have been staring at for so many years. So I created this graph:
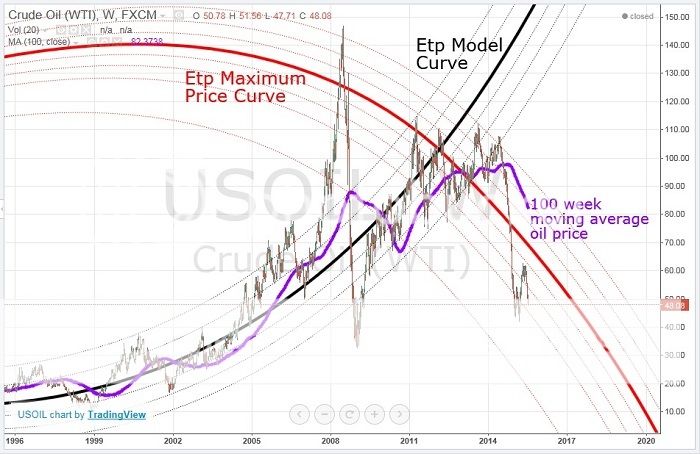
I call this one, "The End of the Oil Age".
When I added the 100 week moving average, I noticed some strange angular moves in the vicinity of the intersection of the two Etp curves. I began to wonder if this might be a sign of what is referred to in non-linear systems dynamics as "squealing". This squealing happens when a system is about to experience a major phase change. If these strange price moves really are squealing, it might constitute independent empirical evidence of the validity of the Etp model.
It is basically an observable Etp signature.
I decided to take a closer look:
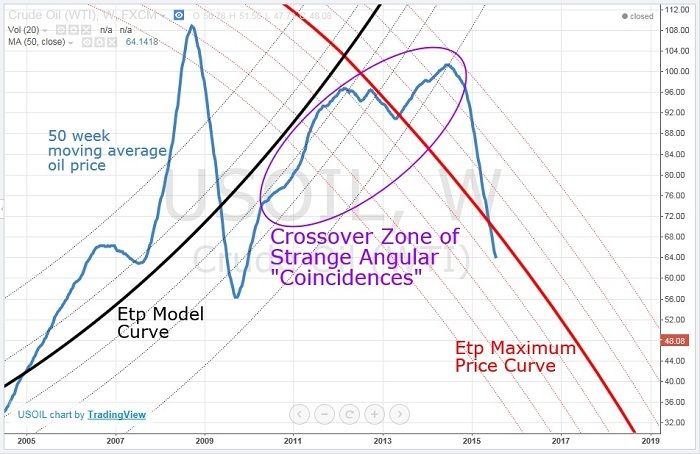
Here is a 50 week moving average. The volatile angular changes very clearly parallel the Etp curves.
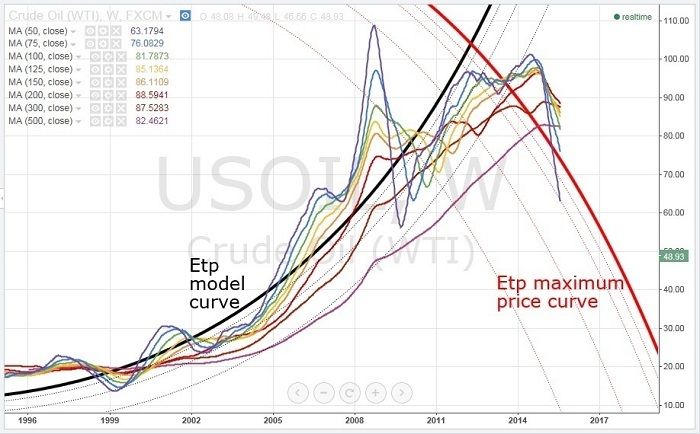
Here I graphed various moving averages and found more evidence of strange angular prices moves everywhere!
This inspired me to produce a detailed set of weekly moving averages:
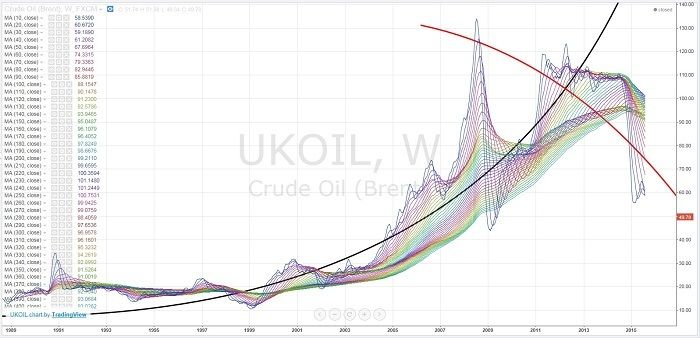
I call this one, "The Dragon in the Sky".
In terms of non-linear systems dynamics, the moving averages can be visualized of as a kind of rubber sheet. The 2008 oil spike didn't last long enough to drag the slower moving averages up very much, and the price collapsed back. But the next spike lasted long enough to drag more of the slower moving averages up above the Etp maximum price curve (i.e. outside the physics limit). The whole system became massively unstable. The resultant chaotic phase change basically folded the rubber sheet completely over itself!
The graph is also reminiscent of water circling a drain.
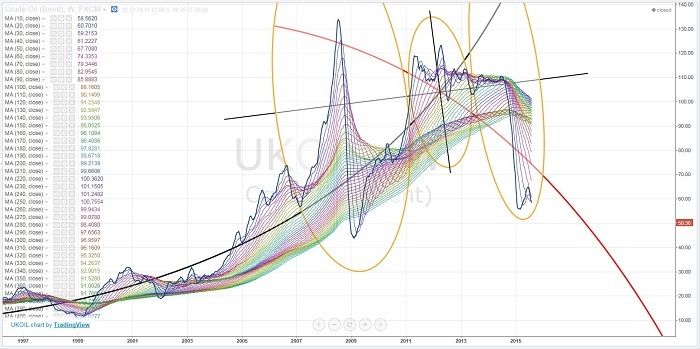
This is a preliminary sketch of a non-linear systems dynamics analysis, with the two Etp curves as strange attractors. The symmetries on either side of the singularity (Etp curve intersection point) are quite striking, and give some possible insight into the coming chaotic price moves.
I think the whole thing could be simulated in fluid dynamics, with two counter rotating cylinders that each follow the Etp curve geometry. Such a set up, with the correct physics analogs, might be able to produce a very accurate price curve, down to approximating the detailed daily and weekly swings.
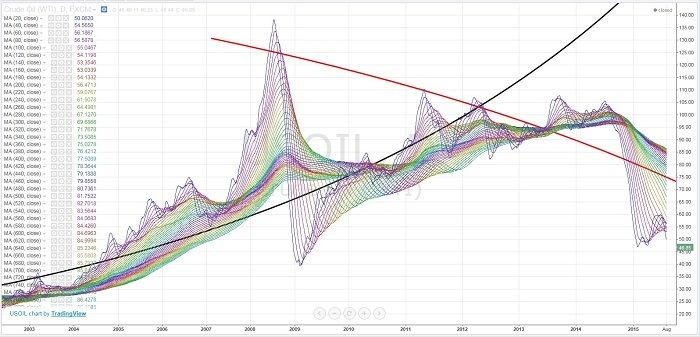
Here is a detailed set of daily moving averages. The twisting and mirror symmetry about the singularity are very visible.
I submit that all of this empirical evidence cannot be mere a coincidence. The price of oil is determined by the laws of physics, not supply and demand.
The Etp model is confirmed."
-----------
And it looks like the oil price and the world stock markets are starting to get the message.
---Futilitist
I have independently confirmed the validity of the Etp model.
http://peakoil.com/forums/the-etp-model-q-a-t70563-180.html#p1262220
"Thanks Pops.
I agree we should stay on topic.
Hi again BW. Thanks for the kind words. The level of knee-jerk hostility that I received when trying to honestly discuss the Etp model at peakoilbarrel helped convince me the Etp model must, in fact, be valid!
The physics of the model made instant sense to me. But when I first saw the Etp model, I was a little frustrated that I couldn't see the Etp curves over the more familiar daily or weekly oil charts I have been staring at for so many years. So I created this graph:

I call this one, "The End of the Oil Age".
When I added the 100 week moving average, I noticed some strange angular moves in the vicinity of the intersection of the two Etp curves. I began to wonder if this might be a sign of what is referred to in non-linear systems dynamics as "squealing". This squealing happens when a system is about to experience a major phase change. If these strange price moves really are squealing, it might constitute independent empirical evidence of the validity of the Etp model.
It is basically an observable Etp signature.
I decided to take a closer look:

Here is a 50 week moving average. The volatile angular changes very clearly parallel the Etp curves.

Here I graphed various moving averages and found more evidence of strange angular prices moves everywhere!
This inspired me to produce a detailed set of weekly moving averages:

I call this one, "The Dragon in the Sky".
In terms of non-linear systems dynamics, the moving averages can be visualized of as a kind of rubber sheet. The 2008 oil spike didn't last long enough to drag the slower moving averages up very much, and the price collapsed back. But the next spike lasted long enough to drag more of the slower moving averages up above the Etp maximum price curve (i.e. outside the physics limit). The whole system became massively unstable. The resultant chaotic phase change basically folded the rubber sheet completely over itself!
The graph is also reminiscent of water circling a drain.

This is a preliminary sketch of a non-linear systems dynamics analysis, with the two Etp curves as strange attractors. The symmetries on either side of the singularity (Etp curve intersection point) are quite striking, and give some possible insight into the coming chaotic price moves.
I think the whole thing could be simulated in fluid dynamics, with two counter rotating cylinders that each follow the Etp curve geometry. Such a set up, with the correct physics analogs, might be able to produce a very accurate price curve, down to approximating the detailed daily and weekly swings.

Here is a detailed set of daily moving averages. The twisting and mirror symmetry about the singularity are very visible.
I submit that all of this empirical evidence cannot be mere a coincidence. The price of oil is determined by the laws of physics, not supply and demand.
The Etp model is confirmed."
-----------
And it looks like the oil price and the world stock markets are starting to get the message.
---Futilitist
