A Note: Global Warming Threads

I find reason to estimate, more than mere hope, that your worst fears re methane lack foundation, because they depend on as yet unobserved and very unlikely rates of heat transfer into quite deep ocean water among other factors, ...
You have it backwards. The warming of the deep ocean, as now, will accelerate the release of CH4, as most of it in ocean is now cold and stable:
Billy T;3123906 in Post 901 said:
Also the deeper oceans are warming faster than the surface as they radiate (or evaporate) away relatively less of what they absorb:
isp5qCVylj7o.jpg
Not good news for ocean methane hydrate stability.
Graph from article here: http://www.bloomberg.com/news/2013-10-23/mystery-of-the-missing-global-warming.html ...
 
Last edited by a moderator:
Andre:Your graph in post 918 does NOT tell what is happening to the VOLUME of arctic sea ice, only the area of ocean it covers. As I recall, the average thickness is now less than half what it was in graph's 1980 thru 2000 averages. I.e. more than half the arctic ocean ice has melted!

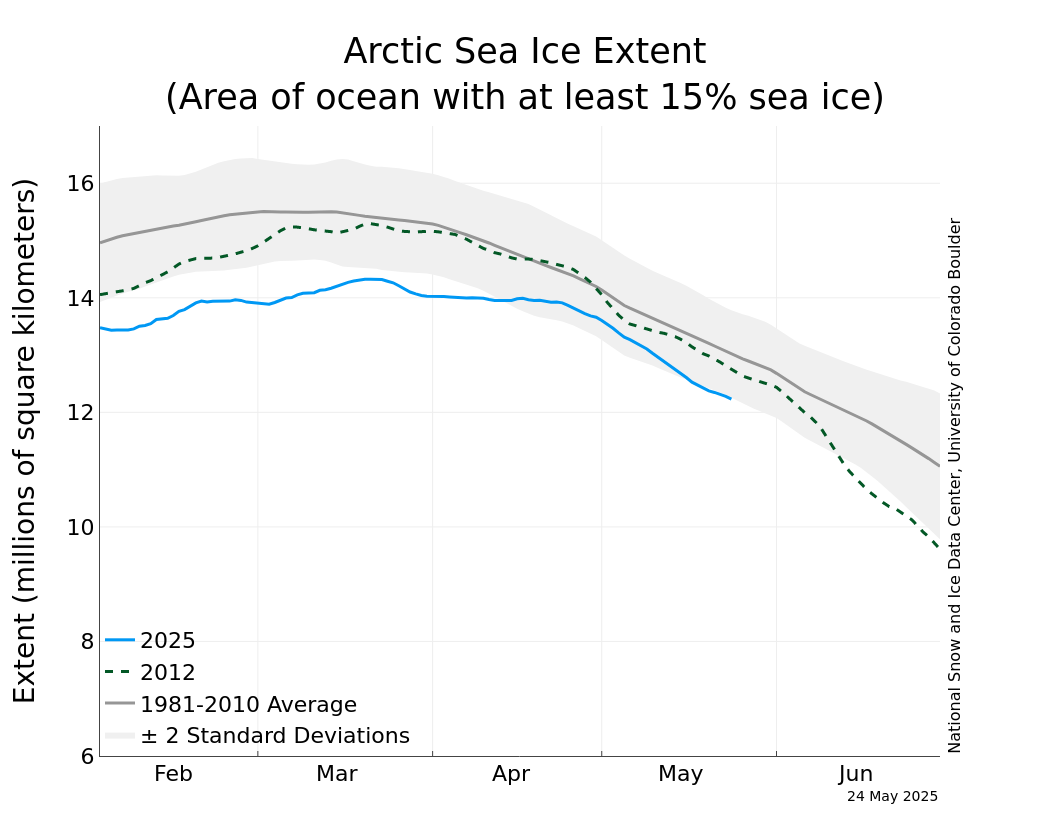
Yes the waves break up the now (fall or Oct thru November) often less than meter thick ice so it does spread out more. Essentially your post 918 graph, but with more recent data and with a little more honesty is also here: http://nsidc.org/cryosphere/sotc/sea_ice.html and reproduced below.
I.e. "honest" as it notes that if only 15% (or more) is ice covered that fraction of the Arctic Ocean is counted as "ice covered." If waves have broken up 100% ice cover to be only 50% ice cover then that would double the "ice coverage." It is the ice volume (or average thickness) that is much more useful indicator of what is happening.
extent_graph_2013.png
kwok_rothrock.gif
Note right graph ends in 2010 and the sharply falling red ICEsat curve was already then below 1 meter (less than 0.5 meter average ice thickness now?) Also left graph is 6 to 10 years old so shows much thicker fall ice. Even if we neglect the self acceleration of ice melting as albedo changes from ~0.9 to ~0.3 or less, absorbing three or more times more solar hearing, just simple linear extension of this melting rate will have Arctic Ocean essentially "ice free" on 1 November 2019 or sooner.
The left graph's black and reddish data - "sub" (submarine's sonar looking up thru the floating ice above it) is very accurate and shows the ice has half melted!

The ice does not need to be all gone for there to be a more economically shipping path to China, etc. from Europe. In fact a few moths ago the first ever non-ice breaker cargo ship set sail for China thru the Arctic Ocean! Next end of summer with even less thick ice more will. I think Prof. Peter Wadham's prediction* in your post 920 is likely to be demonstrated before 2020:I.e. an essentially ice Arctic Ocean as fall starts.

* "In the end it will all just melt away quite suddenly."
Yes that is what will happen when wave energy is being dissipated in 20 to 30 cm thick, one year old or "new ice" sheet ice is still covering large part of the Arctic Ocean in late summer.
 
Last edited by a moderator:
Excellent attempt to move the goal posts and two ad hominems, I wonder how many more to follow.

Say what? Here's what exchemist said:

So what Gore ACTUALLY said was SOME MODELS predicted a 75% CHANCE of the Arctic being ice-free in the summer ,within 5-7 years, i.e. some time between 2014 and 2016.

So:

a) it was not Gore who made the prediction.

b) only SOME models predicted it.

c) what even they predicted was with only 75% confidence.

d) 2014 was the earliest point in a 2 year range.

Apart from that, what you said was perfectly accurate.

Do you believe you think clearly enough to understand science?

Perhaps you'd make a good journalist, though, for, say, the National Enquirer.

Here's what you said for context:

As various sources have predicted a summer ice free Arctic in the early 2000s, it's not an unreasonable assumption:

Murphy: "by the close of the 2000th century"
Bernt Balchen: - 2000
Maslowski: 2013:

"In his speech, Mr Gore told the conference: “These figures are fresh. Some of the models suggest to Dr [Wieslav] Maslowski that there is a 75 per cent chance that the entire north polar ice cap, during the summer months, could be completely ice-free within five to seven years.”

(Done December 15, 2009)


If you're talking about the Nobel prize acceptance speech Al Gore made in 2007, what he actually said was:
Another new study, to be presented by U.S. Navy researchers later this week, warns it could happen in as little as 7 years.

Seven years from now.
Which would make it 2014 (2007 + 7 = 2014) not 2013.

What Maslowski actually said was that the Arctic could be ice free in autum by 2011 - 2016 (or 2016 +/- 3 years), for example, see Maslowski's slide show here
Here is what he has to say as of 2012. But he repeatedly emphasizes the large unceartainties in the models.
 
with a little more honesty

With a little more honesty, this graph comes from your source:

N_stddev_timeseries.png


With even a bit more honesty we should include the main reason for Arctic sea ice decline: wind (again same source)

While 2012 and 2013 extents were similar through May, weather patterns from June to August helped retain more ice. Last summer was marked by lower than average pressure over the Eurasian side of the Arctic and higher than average pressure over Greenland. This resulted in a dipole-like wind pattern that favored ice transport across the ocean and the import of heat from southern latitudes along the Eurasian side of the Arctic. In contrast, this summer was characterized by unusually low pressure over much of the Arctic Ocean, which limited heat import from the south and brought more extensive cloud cover, keeping temperatures lower. In addition, the winds associated with the low pressure caused the ice cover to spread out and cover a larger area.

Then if we even add more honesty, we might include antarctic sea ice cover. (but note the wind again)

As the Arctic was reaching its minimum extent for the year, Antarctic sea ice was reaching record high levels, culminating in a Southern Hemisphere winter maximum extent of 19.47 million square kilometers (7.52 million square miles) on September 22. The September 2013 monthly average was also a record high, at 19.77 million square kilometers (7.63 million square miles) slightly higher than the previous record in 2012. Scientists largely attribute the increase in Antarctic sea ice extent to stronger circumpolar winds, which blow the sea ice outward, increasing extent.

For an honest historical anectdote

It will without doubt have come to your Lordship's knowledge that a considerable change of climate, inexplicable at present to us, must have taken place in the Circumpolar Regions, by which the severity of the cold that has for centuries past enclosed the seas in the high northern latitudes in an impenetrable barrier of ice has been during the last two years, greatly abated.

(This) affords ample proof that new sources of warmth have been opened and give us leave to hope that the Arctic Seas may at this time be more accessible than they have been for centuries past, and that discoveries may now be made in them not only interesting to the advancement of science but also to the future intercourse of mankind and the commerce of distant nations."

President of the Royal Society, London, to the Admiralty, 20th November, 1817
 
billy said:
You have it backwards. The warming of the deep ocean, as now, will accelerate the release of CH4, as most of it in ocean is now cold and stable:
That is exactly what I said, with the additional information that the rate of heat transfer to the deep ocean so far appears to be too slow to touch off a methane catastrophe.

billy said:
Also the deeper oceans are warming faster than the surface as they radiate (or evaporate) away relatively less of what they absorb:
Take another look at your graph - they are not warming faster, but absorbing heat faster, a much different matter. The actual temperature change at the bottom is what frees the methane, not the heat content of the whole volume. The rate of heat transfer observed so far, even though faster than expected, is not fast enough to raise the temperature fast enough to touch off the methane bomb.

There are serious worries, of course - warm currents sinking to the bottom due to salt concentration, that kind of thing - but so far no methane catastrophe seems at all likely.

andre said:
With even a bit more honesty we should include the main reason for Arctic sea ice decline: wind (again same source)
Complete bullshit, as always from you: an irrelevant graph and some technical sounding verbiage you either don't understand or are using deliberately to confuse the naive.

The decline in Arctic ice cover is a trend over several decades now, has been measured in extent and volume and mass and age, and it correlates with the air and ocean temperatures rather than the wind over those decades. And no one with a scientific bent, or otherwise capable of reading graphs and stats, can have failed to see that in the data available for a long time now.
 
Complete bullshit

Please, be so kind to tell that to Nghiem et al...

...The ice loss in January 2007 was also consistent with a northerly wind anomaly of as much as 5 m s1, double the January wind averaged over 50 years from the National Centers for Environmental Prediction (NCEP) reanalysis....

On the two different sides of the TD (Transpolar Drift), a pronounced atmospheric low pressure over the Barents Sea, in concert with a strong high pressure over the Canadian Basin, set up the wind anomaly [Nghiem et al., 2006b]. These atmospheric anomalies loaded ice into the TD and accelerated the TD like a runaway train carrying ice out of the Arctic, noted here as the ‘Polar Express’ (PE).

...and maybe also to Rigor et al as explained here

Winds, Ice Motion Root Cause Of Decline In Sea Ice, Not Warmer Temperatures.
 
From the Rigor et al ScienceDaily item:
"The Arctic Oscillation has been in a primarily moderate to high phase during the last decade or more, and the only way to reproduce this tendency in the oscillation using a numerical climate model is if you include the observed increase in greenhouse gases in the model."

To estimate the age of sea ice, the researchers used a simple model that tracks a grid of ice parcels as they move about the Arctic Ocean. Data about the ice parcels comes from the International Arctic Buoy Program. Under way since 1979, the 40 buoys currently deployed in the ice are from 19 institutions in 10 countries.

The fluctuations in the Arctic Oscillation to its positive phase set the stage for the recent reductions in ice extent, and Rigor and Wallace think low summer sea-ice extents are likely to persist for at least a few years. It is conceivable that, given an extended interval of low-index Arctic Oscillation conditions, ice thickness and summertime sea-ice extent could gradually return to levels characteristic of the 1980s, they say.
Note that the first sentence in no way supports any contention that AGW is a hoax.
And that the last sentence is a conjecture, not a prediction.

Straw man, much?
 
andre said:
Please, be so kind to tell that to Nghiem et al...
- - - -
...and maybe also to Rigor et al as explained here
They're not here, and your use of their research to bullshit here is not their fault.

Or to quote the man, from your link: "The Arctic Oscillation has been in a primarily moderate to high phase during the last decade or more, and the only way to reproduce this tendency in the oscillation using a numerical climate model is if you include the observed increase in greenhouse gases in the model."

That is, the winds you refer to are products of the warming trend rather than alternatives to it.

That, in addition to the fact that the ice loss trend has persisted through decades of various wind regimes (see the graph in your first link, despite its very dubious fifth order regression) , provides explanation for your posting of a graph of the last two years of ice only, and similar nonsense. You aren't making an argument from evidence, but attempting to present evidence in such a way that it creates an illusion of supporting your claims.
 
Andre: Yes I agree the wind (and the waves it makes) is very strong factor in determination of the melting rate of Arctic ice. Said so here:
{part of post 992}Your graph in post 918 does NOT tell what is happening to the VOLUME of arctic sea ice, only the area of ocean it covers. As I recall, the average thickness is now less than half what it was in graph's 1980 thru 2000 averages. I.e. more than half the arctic ocean ice has melted!

Yes the waves break up the now (fall or Oct thru November) often less than meter thick ice so it does spread out more. ... if only 15% (or more) is ice covered that fraction of the Arctic Ocean is counted as "ice covered." If waves have broken up 100% ice cover to be only 50% ice cover then that would double the "ice coverage." It is the ice volume (or average thickness) that is much more useful indicator of what is happening. ...

Even if we neglect the self acceleration of ice melting as albedo changes from ~0.9 to ~0.3 or less, absorbing three or more times more solar hearing, just simple linear extension of this melting rate will have Arctic Ocean essentially "ice free" on 1 November 2019 or sooner.

The ice does not need to be all gone for there to be a more economically shipping path to China, etc. from Europe. In fact a few moths ago the first ever non-ice breaker cargo ship set sail for China thru the Arctic Ocean! Next end of summer with even less thick ice more will. I think Prof. Peter Wadham's prediction* in your post 920 is likely to be demonstrated before 2020:I.e. an essentially ice Arctic Ocean as fall starts.

* "In the end it will all just melt away quite suddenly."
Yes that is what will happen when wave energy is being dissipated in 20 to 30 cm thick, one year old or "new ice" sheet ice is still covering large part of the Arctic Ocean in late summer.
In addition to the three fold increase in solar absorption wind's waves spreading broken ice sheet adds / brings warmer water in contact with much greater extent of floating "ice edges," the breaking itself adds energy to the ice. I.e. to break any solid, you must do work on it - add energy to it.

Fundamentally because your are creating an increase in total surface area, and thus the "surface energy" held by the solid is increased.** The fact, your references noted, that the wind can blow ice pieces out into the non-arctic oceans to quickly melt them, when the direction of the wind is that way. is of course very important reason why the total volume of ice decrease more in some years than in other years, but EVERY YEAR, the several times faster temperature rise in the Arctic (than globally) due to GW is melting ice.

** But in practice the breaking also sets up sound and other waves in both new pieces and these waves "die out" giving their energy to the solid too. Just "flexing" a solid adds energy to it also - easy to show: take any wire you can bend and repeatedly bend it until it gets too hot to hold in your bare hands. Waves are very important indirect form of solar heating melting ice.
 
Last edited by a moderator:
the total volume of ice decrease more in some years than in other years, but EVERY YEAR, the several times faster temperature rise in the Arctic (than globally) due to GW is melting ice.

However, when GW is a global signal, what then is making the Antarctic ice grow a bit more, on the average, every year?

The ice volume of the Arctic has been erratic throughout the millenia, it was also likely greatly reduced around 9000 years ago, causing Siberian tree lines to reach the Arctic oceans (McDonald et al 2000). So as it happened before, without greenhouse effects, what makes it so sure that this time it must be the greenhouse. How about a interaction of the Arctic Oscillation and the North Atlantic Oscilation, combined with other effects?
 
andre said:
However, when GW is a global signal, what then is making the Antarctic ice grow a bit more, on the average, every year?

There are several mechanisms by which a global warming trend can cause an expansion of Antarctic sea ice extent - from higher rates of glacial flow into the ocean, to increased snowfall from moisture laden (warmer) air, to effects on boundary currents in the ocean and boundary windflow patterns in the atmosphere. Do you consider them all invalid, and if so why?

andre said:
it was also likely greatly reduced around 9000 years ago, causing Siberian tree lines to reach the Arctic oceans (McDonald et al 2000).
Why do you think more northerly tree lines would be "caused" by, or even correlated with, a reduction of Arctic sea ice such as we are experiencing?
 
However, when GW is a global signal, what then is making the Antarctic ice grow a bit more, on the average, every year?
It's been widely predicted since the '80s (I'll track down some papers for you when I have the time if you want) that:

1. Because of the Antacrtic circumpolar current, the Antarctic experiences a degree of thermal insulation and isolation from the rest of the world.
2. Because of this effect the warming in the Antarctic is predicted to lag behind the warming in the Arctic.
3. It was predicted in the '80s or '90s that because of the increased moisture content in the air would lead to increased precipitation in the Antartic resulting in no change in, or net growth of the antarctic ice sheet.
4. A corrollary of #3 is that because of the conservation of mass this has the net effect of reducing or eliminating sea level rise for a period of time.
5. The only way #3 can be true is if some or all of the icesheet experiences some degree of acceleration of the transport of its ice from the interior to the ocean.
6. A corrollary of #6 is an increased amount of iceberg calving feeding the growth of sea ice, which would tend to be enhanced by #1 and #3.
 
Why do you think more northerly tree lines would be "caused" by, or even correlated with, a reduction of Arctic sea ice such as we are experiencing?

Mac Donald et al 2000, from the abstract

The development of forest and expansion of treeline likely reflects a number of complimentary environmental conditions, including heightened summer insolation, the demise of Eurasian ice sheets, reduced sea-ice cover, greater continentality with eustatically lower sea level, and extreme Arctic penetration of warm North Atlantic waters.

Moreover, there are more studies indicating quite a bit of variation in Arctic (ice/sea surface temperature, AO, NAO) dynamics during the Holocene, like for instance Darby et al 2001, Darby et al 2012, Kim et al 2004,Olsen et al 2012.

This would beg the question why current variability in Arctic ice dynamics is necesarily attributed to anthropogenic causes.
 
Last edited:
(I'll track down some papers for you when I have the time if you want)

As you can see from the previous, I show my sources for scrutiny. Has something to do with due dilligence. Not everybody does.

Oh and 'THEY're HERE' sends her regards.
 
As you can see from the previous, I show my sources for scrutiny. Has something to do with due dilligence. Not everybody does.
As do I ordinarily, however, I don't always have the time to trackdown the orginal papers for any one of a number of reasons. For example, the post you are replying to was made from my work place on my personal mobile device. Tracking down papers at work isn't always an option. I always try and get back to a thread where I have made such a promise, however, I'm absent minded, have a disabled wife, two children, and work fulltime. Sometimes things get forgotten.

Of course, you could have looked into the claims for yourself - nothing stopping you from doing that.

Oh and 'THEY're HERE' sends her regards.
Cool. Say hi back to her for me.
 
... as it happened before, without greenhouse effects, what makes it so sure that this time it must be the greenhouse. How about a interaction of the Arctic Oscillation and the North Atlantic Oscilation, combined with other effects?
I'm not 100% sure it is, especially as I tend to be skeptic bout many claims, but the rate of floating Arctic ice mass melting (more than half melted in the last decade, I think.) does seem to be too fast for any other explanation.

I have many times posted that it is the un-precedented* RATE of CO2 release and the never before observed by man, bubbling up of CH4 in dense (sub sonar killing) Arctic Ocean bubble clouds that concerns me that we may be making a possible great disaster for mankind (and other warm blooded animals that cool by evaporation as being in a wet-bulb environment of only 35C will kill you in less than an hour and due to increased ocean evaporation, the amount of rain and average air humidity is increasing now.) The fact that increasing atmospheric concentrations of CH4, increase the half life of CH4 in the air and CH4 is at least 10 times better IR absorber than CO2 is sort of scary too.** - If present rates of CH4 continue, even neglecting their self- accelerations, then in a few decades at most, CH4 will be a more important GHG than CO2.

* Except perhaps during large volcanic eruptions.

** Currently the CO2 concentration, in ppm, is ~ 400 and that of CH4 averages ~1.816 (data sources and more discussion in post 909). So there is 400 / 1.816 = 220 times less CH4 concentration than CO2 in the air, and CH4 absorption is still in a linear absorption-function concentration range. If the CH4 concentration were to increase by a factor of only 1.85/0.51 = 3.627 to an average concentration of 6.59 ppm then it would be as important as CO2 is now and still in the linear function range. CH4 is the real GHG threat, not CO2, that all focus on.

That is why I think it is imperative that man switches away from petroleum ASAP as burning it seems to be a very likely cause for rapid rise in both CO2 and CH4 atmospheric concentrations. How to easily*** do this is well known: Demonstrated in Brazil for more than 3 decades to be both practical and even more economical than using gasoline as car fuel on a per mile driven basis!

The volume of alcohol fuel needed to fuel all the world's cars, even if cellulosic alcohol does not prove to be economically competitive with that produced from sugar cane, can be produced with only about 2% of the earth's arable land growing sugar cane. (Or less than 1% of Earth's "agricultural land.") The advances of modern agriculture can increase the yield per acre, compared to the primitive means used in large areas, by at least 20% so while switching to sugar cane based alcohol, there could be also at least a 10% increase in the production of food and fiber.

*** Only trivial modifications to the current factories producing liquid fuel IC engine cars are required to switch to alcohol fuel. The cost of switching factories to that production would be at least 10 times less than switching to factories producing battery powered cars and even converting almost all existing gasoline car to alcohol fuel is a small: <3% of their cost, why not do this, to be safe?

PS - Want to know why more economical than gasoline alcohol fuel is not already the norm? Answer: Vested interest "big oil" lies: Say that switching to alcohol would destroy the rain forests. Big oil also diverts public attention from the facts they don't like by promoting alternate fuels like hydrogen that can never compete economically with their gasoline. Go ahead, Sucker, fill up with gasoline and pay higher taxes so Big Oil can get its "depletion allowances," and other subsides you pay them as well as paying more at the pump than you need to!
 
Last edited by a moderator:
As you can see from the previous, I show my sources for scrutiny. Has something to do with due dilligence. Not everybody does.

Oh and 'THEY're HERE' sends her regards.

True to my word - I assume by your response you want to see papers (It's been six months since I looked at this one last):

From 1988, and predicts cooling poleward of the circumpolar current.
Interhemispheric Asymmetry in the Transient Response of a Coupled Ocean-Atmosphere model to a CO2 Forcing: Bryan, Manabe & Spelman 1988
A very different response was found in the predominantly land-covered Northern Hemisphere compared to the largely ocean-covered Southern Hemisphere. In the predominantly ocean covered hemisphere the response of sea surface temperature lags substantially behind the corresponding response in the predominantly land covers... ...However it is of particular interest that there was almost no response in polar latitudes of the Southern Ocean four decades after "switch on". In fact there was a slight cooling poleward of the Circumpolar Current.

Snowfall-Driven Growth in East Antarctic Ice Sheet Mitigates Recent Sea-Level Rise: Davis et al, 2005
Our results show that the East Antarctic ice-sheet interior increased in overall thickness within the ROC from 1992 to 2003 and that this increase is probably the result of increased snowfall. Both of these observations are consistent with the latest IPCC prediction for Antarcticas likely response to a warming global climate (6). However, the IPCC prediction does not consider possible dynamic changes in coastal areas of the ice sheet. Moreover, these results have only sparse coverage of the coastal areas where recent dynamic changes may be occurring (4). Thus, the overall contribution of the Antarctic ice sheet to global sea-level change will depend on the balance between mass changes on the interior and those in coastal areas.

IPCC First Asessment: Chapter 9 - Sea Level Rise (1990)
Support for the idea that higher temperatures will lead to significantly larger accumulation also comes from observations on the Antarctic Peninsula. Over the past 30 years temperature has gone up here by almost 2°C, whereas accumulation increased by as much as 25% in parallel with this (Peel and Mulvaney, 1988). Although this cannot be taken as proof of a causal relationship it is in line with the sensitivity estimates listed in Table 9.7 which span a factor of two.

In summary, all quoted studies show an increase in accumulation with warming and thus a decrease in sea level. An ablation zone does not effectively exist in Antarctica, and a large warming would be required in order for ablation to influence mass balance.
So even the IPCC predicted in 1990 that the Antarctic Icesheet may grow leading to a reduction in sea level rise. Also note that they cite papers (apparently) predicting this dating back as far as 1977. They also note that whether the mass change in the antarctic ice sheet leads to a rise or lowering of sea level (in the near future at least anyway) is a result of the complicated interaction between wasting at the periphery and accumulation in the interior. They also go on to discuss the possibility of instability in the west antarctic ice sheet as a seperate topic.
 
True to my word - I assume by your response you want to see papers

Thanks, Trippy, much appreciated. I'll study it before responding, maybe tomorrow, I do have a bit of a social life and online/study time is limited. Also Billy is entitled to a long detailed response.

One thing after glancing over the list, not sure if we compare apples with apples, ie sea ice cover with land based ice sheet accumulation.

You may have a valid point, but I find it hard to imagine that the sea ice cover is independent of the predicted increase in precipitation and the predicted cooling poleward of the circumpolar current, hence mentioning it in the first place.

Alternatively you can consider this paper from 1977 which discusses sea ice formation in relation to Stefan's Law - especially in terms of the deep ocean warming.

Antarctic sea ice growth and oceanic heat flux: Ian Allison (1977)

Note equation (1) which states:

$$h^{2} = \frac{2k}{\rho L} \int^{T}_{0} \theta dt $$

Where $$h^{2}$$ is the thickness of the sea ice and $$\theta$$ is the temperature difference between the lower and upper ice surfaces (I believe this is also why warm water freezes faster than cold water). Also worth noting is that the biggest problem the Stefan Law has in predicting the sea ice thickness is that it tends to over estimate it.
 
Last edited:
andre said:
Why do you think more northerly tree lines would be "caused" by, or even correlated with, a reduction of Arctic sea ice such as we are experiencing?
Mac Donald et al 2000, from the abstract
That's nowhere near sufficient reason - a reduction of Arctic sea ice is a common event in paleontological time; a reduction such as we are experiencing has no precedent - certainly nothing from your link establishes one.

Tree lines take many hundreds, even thousands, of years to move long distances.

andre said:
How about a interaction of the Arctic Oscillation and the North Atlantic Oscilation, combined with other effects?
Sure. It would be a legitimate question, if you could assume your audience was as ignorant as you need them to be. But if you actually do that, as several people have including your linked scientists, you'll find it doesn't account for the ice loss. That's what your link said, remember? I quoted the guy for you.

andre said:
One thing after glancing over the list, not sure if we compare apples with apples, ie sea ice cover with land based ice sheet accumulation.
In Antarctica, your chosen subject, they are closely linked. Antarctica is a large body of land surrounded by water, quite different from the Arctic Ocean, if you recall.

trippy said:
(I believe this is also why warm water freezes faster than cold water).
You might want to reconsider that. Obviously it is not true in the extremes (or one could design an icemaker of truly astounding capability: supply a very cold cup of water - one on the point of freezing - to a large room full of trays of hot water, and get mega quantities of ice in minutes).
 
Back
Top